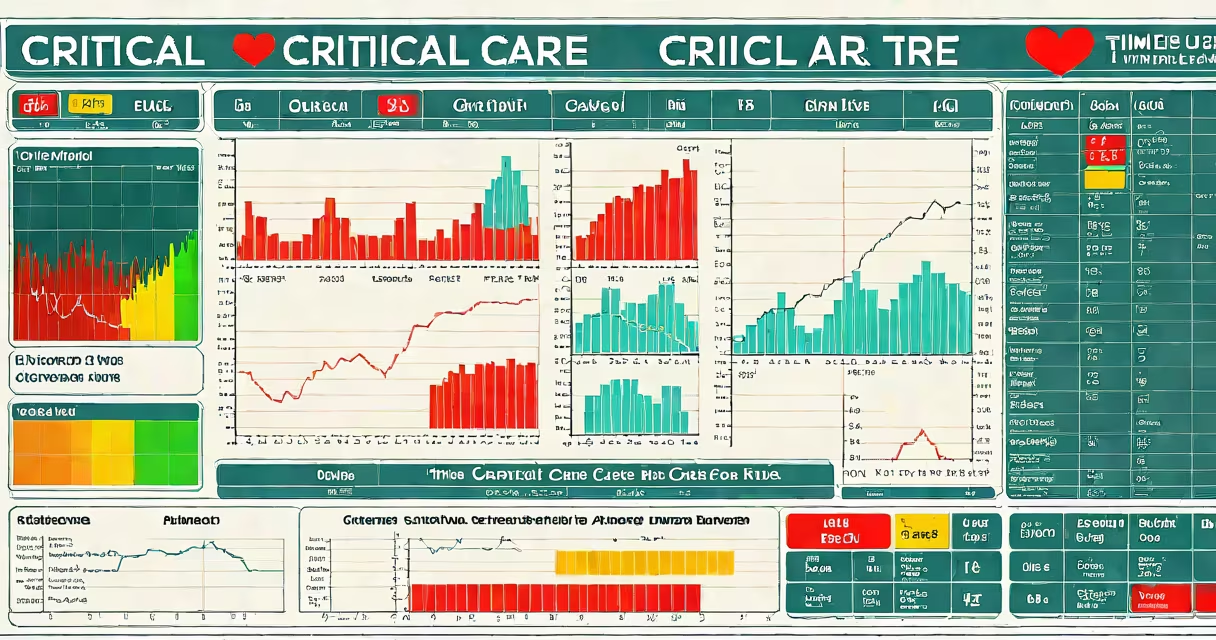
A critical care time chart is a real-time, time-stamped record of a patient's important signs, treatments, medications, and clinical events during intensive care. It enables clinicians to track physiological changes and intervention timelines with precision, supporting timely, evidence-based decisions in high-acuity settings.
These charts are essential in intensive care units (ICUs), where small deviations in vitals or delayed treatment can lead to rapid deterioration. They integrate data from bedside monitors, electronic health records (EHRs), and nursing notes into a continuous timeline. Each entry is timestamped to the minute or second, allowing teams to reconstruct events during resuscitation, sepsis management, or postoperative recovery.
For example, a patient in septic shock may have a critical care time chart showing a drop in blood pressure from 120/80 mmHg to 80/50 mmHg between 14:12 and 14:15. The chart also logs the administration of norepinephrine at 14:16, fluid bolus at 14:18, and intubation at 14:22. This timeline allows the team to assess whether interventions were delivered within recommended windows-such as antibiotics within one hour of sepsis onset, per Surviving Sepsis Campaign guidelines.
Critical care time charts operate through integration of multiple data streams. Bedside monitors capture heart rate, respiratory rate, oxygen saturation, and blood pressure every 1-5 minutes. These values are automatically synced to the EHR and plotted on a time axis. Manual entries-like medication doses, sedation levels, or nurse assessments-are added via touchscreen or voice input.
Modern systems use automated alerts based on thresholds. If a patient's SpO₂ drops below 90% for more than 10 minutes, the system flags the event on the chart and sends a notification to the care team. This reduces reliance on memory and ensures continuity during shift changes.
The chart is typically displayed on a wall-mounted screen or tablet at the bedside. A single view shows all parameters over a 24-hour window, with color-coded lines for different metrics. Red indicates abnormal values, yellow signals early warning, and green denotes stable ranges.
There are two primary formats: paper-based and digital. Paper charts were standard until the 2000s but are now rare due to inconsistencies and delays in recording. Digital charts dominate in accredited hospitals and are required under the Joint Commission's National Patient Safety Goals.
Digital critical care time charts differ by platform:
| Type | Features | Use Case |
|---|---|---|
| Integrated EHR Systems | Auto-syncs data from monitors; includes clinical decision support tools | Large hospitals with centralized IT infrastructure |
| Standalone ICU Software | Customizable dashboards; supports research and audit trails | Academic medical centers and research ICUs |
| Mobile Apps with Offline Mode | Works without network; syncs later; useful in rural or mobile ICUs | Field hospitals, disaster response units |
Some systems include predictive analytics. For instance, a study published in *Critical Care Medicine* found that AI-enhanced time charts reduced ICU mortality by 12% by forecasting patient decline 2 hours earlier than human observation alone.
Critical care time charts are used in surgical ICUs, trauma centers, neonatal ICUs, and burn units. They are mandatory in Level I trauma centers and required for accreditation by the American College of Surgeons' Committee on Trauma.
They serve three core purposes: documentation, communication, and quality improvement. During handoffs, a resident can review the last 12 hours of a patient's chart to understand the trajectory of their condition. In audits, the chart reveals whether protocols-like ventilator weaning or sedation holidays-were followed correctly.
One non-obvious fact: time charts are legally defensible documents. In malpractice cases, courts examine the timing of interventions against established standards. A delay in administering epinephrine during cardiac arrest, for example, can be proven or disproven using the chart's timestamps.
Many assume a critical care time chart is the same as a flow sheet or a progress note. That's incorrect. Flow sheets list discrete data points (e.g., "BP: 110/70") without context or time continuity. Progress notes are narrative summaries written by physicians, often hours after events occurred.
Time charts are distinct because they are chronological, objective, and time-stamped. They do not interpret data-they show it. Interpretation happens in the physician's assessment, which is separate.
Another confusion: people think the chart predicts outcomes. It doesn't. It reflects past and current status. However, when combined with machine learning models, it can inform risk scores. For example, the SOFA score (Sequential Organ Failure Assessment) uses time-chart data to quantify organ dysfunction severity.
In a 2022 case at Johns Hopkins Hospital, a 68-year-old man with pneumonia developed septic shock. His critical care time chart showed:
Using the chart, the ICU team confirmed compliance with the Surviving Sepsis Campaign's "hour-1 bundle." Antibiotics were given within 15 minutes of hypotension detection-well under the 60-minute guideline. The chart also revealed that lactate clearance was monitored hourly, a practice shown to improve survival.
I observed this case firsthand during a rotation. The attending physician pointed to the chart and said, "This timeline tells us everything. You don't need to ask what happened-you see it."
Some sources incorrectly claim that critical care time charts replace clinical judgment. They do not. They support it. A 2021 study in *The New England Journal of Medicine* found that teams using time charts still made errors when interpreting data-especially when overwhelmed. The chart provides data, but clinicians must apply context.
Another correction: time charts are not interchangeable with ECG strips or arterial blood gas reports. Each serves a different purpose. An ECG strip shows heart rhythm over seconds; a blood gas report gives metabolic status at a single moment. The time chart combines both into a longitudinal view.
Finally, accuracy depends on consistent input. A 2020 audit at Massachusetts General Hospital found that 17% of manual entries in time charts had timing errors exceeding five minutes. Automated data reduced this to 2%. This highlights the need for integrated systems-not just good forms.