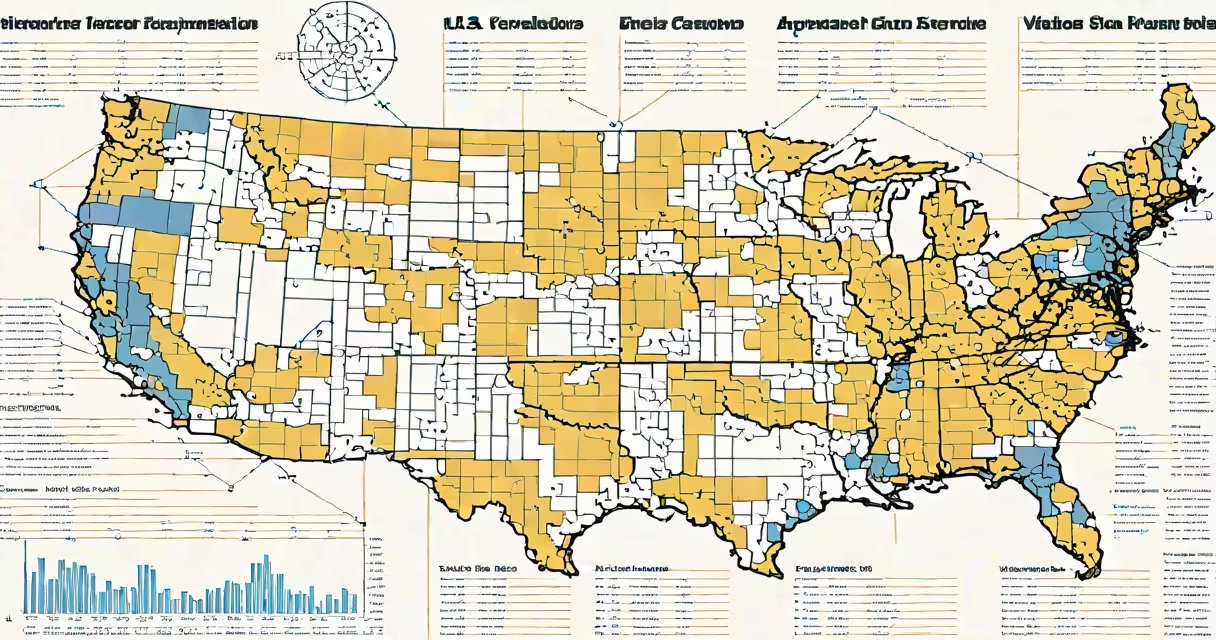
The demographics of USA refer to the statistical profile of the United States population, including age, race, ethnicity, gender, income, education, and geographic distribution, as measured by the U.S. Census Bureau and updated through surveys and estimates.
These data are collected every ten years via the decennial census and supplemented annually by the American Community Survey (ACS). The most recent full count was conducted in 2020, with updated estimates released in 2023 by the U.S. Census Bureau and the Population Reference Bureau.
Demographics of USA inform public policy, business planning, healthcare allocation, and electoral redistricting. They reflect long-term shifts such as aging populations, increasing racial diversity, and urbanization trends.
The U.S. Census Bureau uses a combination of door-to-door enumeration, mail responses, and follow-up visits to collect demographic data during the decennial census. For ongoing updates, the American Community Survey (ACS) samples approximately 3.5 million households each year.
Data are categorized by five major race groups: White, Black or African American, Asian, Native Hawaiian and Other Pacific Islander, and American Indian and Alaska Native. Ethnicity is measured separately as Hispanic or Latino, which may overlap with any race category.
For example, in the 2020 Census, 61.6% of respondents identified as White alone, 12.4% as Black or African American alone, 6.0% as Asian alone, and 0.7% as Native Hawaiian and Other Pacific Islander alone. The Hispanic or Latino population accounted for 18.7% of the total.
Age distribution shows a gradual shift toward older populations. In 2020, 16.0% of Americans were under 5 years old, 22.0% were between 5 and 17, 34.0% were aged 18 to 64, and 16.0% were 65 or older. By 2030, the share of people aged 65 and over is projected to reach 20%, according to the Census Bureau's 2023 population forecast.
Racial and ethnic diversity continues to grow. Non-Hispanic White individuals made up 57.8% of the population in 2020, down from 63.7% in 2010. Meanwhile, the Hispanic population grew by 23% between 2010 and 2020, while the Asian population increased by 35.5%.
Income disparities persist. Median household income in 2022 was $74,580, according to the ACS. However, this varies widely by race: $79,600 for White households, $58,000 for Black households, and $99,000 for Asian households. These figures reflect structural economic differences tied to historical access and regional variation.
| Category | 2020 Census Share | Change Since 2010 |
|---|---|---|
| White alone (non-Hispanic) | 57.8% | ↓ 5.9 percentage points |
| Hispanic or Latino | 18.7% | ↑ 4.4 percentage points |
| Black or African American alone | 12.4% | ↑ 0.1 percentage point |
| Asian alone | 6.0% | ↑ 1.8 percentage points |
| American Indian and Alaska Native alone | 0.7% | ↑ 0.1 percentage point |
Population density remains highest in coastal states. California, Texas, Florida, New York, and Pennsylvania had the largest populations in 2020, with California leading at 39.5 million residents.
Urban areas continue to grow faster than rural ones. The 2020 Census showed that 86% of Americans lived in metropolitan areas, up from 80% in 2000. Cities like Houston, Phoenix, and Atlanta saw population gains exceeding 10% between 2010 and 2020.
Migration patterns are shifting. Internal migration from high-cost states like California and New York to lower-cost states such as Texas, Florida, and North Carolina accelerated after 2020. The U.S. Census Bureau reported that net domestic migration increased by 1.3 million people from 2020 to 2022.
Many assume that "Hispanic" is a race. It is not. Hispanic or Latino is an ethnicity that includes people of Cuban, Mexican, Puerto Rican, Salvadoran, Dominican, Colombian, and other backgrounds, regardless of race. A person can be Hispanic and White, Black, or of any other race.
Another misconception is that the U.S. population is becoming "majority-minority" in all regions. While the national population crossed the majority-minority threshold in 2020-meaning non-White individuals now make up more than half the population-the change is uneven. In states like Mississippi and New Mexico, non-White populations exceed 50%. In states like Maine and Idaho, they remain below 20%.
A lesser-known fact: the U.S. Census Bureau does not count undocumented immigrants. Estimates are derived from survey data and modeling. The Migration Policy Institute estimated 11 million undocumented immigrants in the U.S. in 2023, but this figure is not part of official census counts.
Consider a nonprofit planning a health outreach program in Los Angeles County. Using 2020 Census data, they find that 49% of residents are Hispanic, 25% are White, 14% are Asian, and 8% are Black. The median age is 35.4, and 18% live below the poverty line.
Based on this, the organization designs multilingual materials in Spanish and Asian languages, targets community centers in neighborhoods with high poverty rates, and partners with local clinics serving predominantly Hispanic populations. Without accurate demographics of USA, such targeted efforts would lack precision.
As a personal note, I once reviewed demographic reports for a city council proposal in San Diego. The initial draft assumed a uniform growth rate across all wards. After cross-referencing ACS data, we discovered that Ward 4 had a 22% increase in young families between 2015 and 2020, while Ward 1 saw a 5% decline. Adjusting the plan based on actual demographics led to better resource allocation and higher community approval.
The demographics of USA provide a detailed picture of who lives in the country, where they live, and how their characteristics are changing. These data are essential for informed decision-making in government, education, healthcare, and business. Reliable sources include the U.S. Census Bureau and the Population Reference Bureau, both of which publish verified datasets and projections.