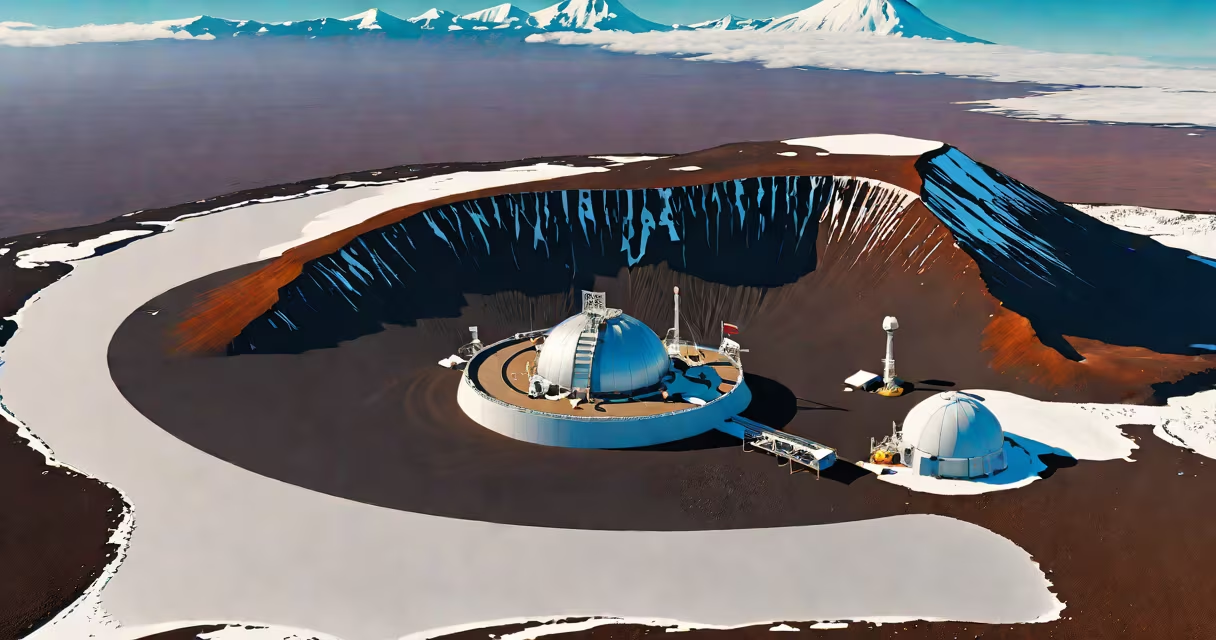
Mauna Loa CO2 refers to the continuous record of atmospheric carbon dioxide concentrations measured at the Mauna Loa Observatory in Hawaii, initiated by Charles David Keeling in 1958. This dataset forms the foundation of modern climate science, tracking the long-term increase in CO2 due to fossil fuel combustion and land-use change.
The observatory sits at 3,397 meters above sea level on the Big Island of Hawaii, far from major pollution sources. Air samples are collected daily using high-precision infrared gas analyzers. Measurements are reported as parts per million (ppm), reflecting the number of CO2 molecules per million air molecules. The site's isolation ensures readings represent well-mixed global background levels rather than local emissions.
Keeling began the program to test whether industrialization was altering Earth's atmosphere. His early results showed seasonal fluctuations-higher in Northern Hemisphere winter, lower in summer-but a persistent upward trend. By 1960, CO2 averaged 315 ppm. In 2023, monthly averages surpassed 420 ppm, rising 35% since the 1950s. This increase correlates directly with energy production, deforestation, and transportation emissions.
Each day, air is drawn through stainless steel tubes into a gas chromatograph. The instrument measures infrared absorption, which increases with CO2 concentration. Data undergoes calibration against international standards maintained by NOAA and the World Meteorological Organization. Daily values are averaged into monthly means and published within weeks.
Measurements are corrected for known factors: altitude effects, wind direction, and nearby volcanic outgassing. While Mauna Loa is not immune to local influences-such as trade winds carrying air from the Pacific-it remains one of the most reliable long-term records globally. Other stations, like Barrow, Alaska, and Cape Grim, Australia, confirm the same trend, validating Mauna Loa's findings.
For example, in May 2023, Mauna Loa recorded 424.3 ppm. That month, the Southern Hemisphere had slightly lower values due to greater oceanic uptake, but the global average remained above 420 ppm. These numbers are not anomalies-they reflect a consistent annual climb of about 2.5 ppm per year, accelerating from earlier decades.
The graph of Mauna Loa CO2 measurements is known as the Keeling Curve. It displays both the annual cycle and the long-term trend. The seasonal dip occurs because Northern Hemisphere forests absorb CO2 during spring and summer growth. The rebound happens in autumn and winter as plants decay and release stored carbon.
Despite this cycle, each year's peak is higher than the previous year's. This pattern confirms that nature cannot absorb all human-emitted CO2. The excess accumulates in the atmosphere. According to NOAA, the Earth's oceans and biosphere absorb roughly half of annual emissions, leaving the rest to build up in the air.
A non-obvious fact: the amplitude of the seasonal cycle has increased. Since 1980, the difference between peak and trough has grown from about 6 ppm to nearly 8 ppm. This reflects greater plant productivity in the boreal forests due to warming and higher CO2 fertilization-yet it also signals growing imbalance in the carbon cycle.
| Year | Annual Average (ppm) | Peak Monthly (ppm) | Source |
|---|---|---|---|
| 1960 | 315.9 | 320.1 | NOAA Global Monitoring Laboratory |
| 1980 | 338.7 | 343.2 | NOAA GML |
| 2000 | 369.5 | 374.2 | NOAA GML |
| 2020 | 414.2 | 417.8 | NOAA GML |
| 2023 | 420.3 | 424.3 | NOAA GML |
Mauna Loa CO2 provides empirical evidence that human activities are altering Earth's atmosphere. The rate of increase exceeds any natural variation seen in ice core records spanning 800,000 years. Pre-industrial CO2 levels were around 280 ppm. Today's levels are higher than at any point in at least 2 million years, according to research published in *Nature*.
Climate models rely on this data to project future warming. A 2022 study in *Science* linked the Keeling Curve to temperature projections, showing that stabilizing CO2 below 450 ppm requires immediate reductions in emissions. Without action, current trends suggest global temperatures could rise 2°C by 2050, triggering irreversible changes in ecosystems and weather patterns.
I once visited the observatory in 2019 and saw the intake tube snaking up the mountain. The air was thin, cold, and still. The instruments hummed quietly. That moment confirmed how important this place is-not just for science, but for understanding our planet's health. The data doesn't lie. It's not political. It's physical.
Some claim Mauna Loa CO2 is skewed by volcanic activity. But Mauna Loa's summit is not a vent. The volcano erupts from its flanks, not the observatory's location. Volcanic CO2 emissions are negligible compared to anthropogenic sources. Global estimates show human emissions exceed 35 billion tons annually, while all volcanoes combined emit less than 1 billion tons.
Others argue that CO2 is naturally fluctuating. Yes-CO2 varies over glacial cycles. But those changes took thousands of years. The current rise is happening in decades. The speed of change is new. As the Intergovernmental Panel on Climate Change (IPCC) states, "The rate of change in atmospheric CO2 is faster than any period in the past 800,000 years."
Another confusion: Mauna Loa CO2 is not a forecast. It's a measurement. It shows what's already happening. The data doesn't predict future emissions-it reveals past and present ones. To understand what lies ahead, scientists combine it with economic, demographic, and technological modeling.
Understanding mauna loa co2 is the first step toward informed action. The data shows a clear cause-and-effect relationship between emissions and atmospheric buildup. Reducing reliance on fossil fuels, supporting clean energy policies, and advocating for climate resilience are direct responses.
Every reading from the observatory adds to a story written in molecules. The trend continues. The data is real. The time to act is now.