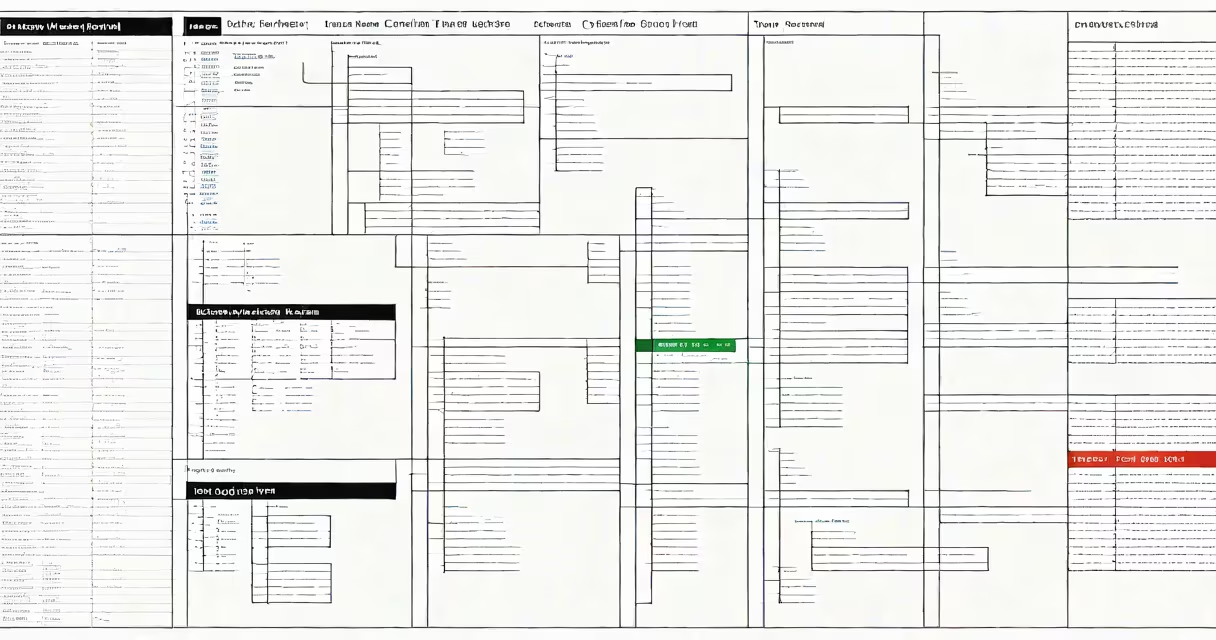
A microsoft office gantt chart is a visual timeline tool that displays project tasks, durations, start and end dates, and dependencies within Microsoft Excel or Microsoft Project. It enables teams to track progress, allocate resources, and meet deadlines through a structured, color-coded bar chart format.
These charts are built into Microsoft Office applications designed for project planning. In Excel, they're created using stacked bar charts with custom formulas. In Microsoft Project, they appear automatically when you enter tasks and set dates. Both tools support changing updates as project timelines change.
For example, a marketing team launching a product uses a microsoft office gantt chart to assign tasks like "design logo" (start: March 1, duration: 5 days), "write copy" (start: March 6, duration: 3 days), and "print samples" (start: March 10, duration: 7 days). The chart shows overlaps, gaps, and critical path risks.
Each horizontal bar represents a task. The bar's length corresponds to the task's duration, and its position along the timeline shows start and end dates. Bars align under a date axis, often spanning weeks or months. Color coding indicates status: green for on track, yellow for delayed, red for overdue.
In Excel, users build the chart manually. They list tasks, define start and end dates, then use a stacked bar chart with a series for each task. The formula for bar width is: =End Date - Start Date. To show progress, a second series overlays completed work as a darker bar inside the task bar.
Microsoft Project automates this process. Enter tasks, assign durations, set predecessors (dependencies), and the software generates the Gantt chart instantly. It recalculates when changes occur-like shifting a deadline-and flags schedule conflicts.
Two primary tools in Microsoft Office generate gantt charts:
| Tool | Best For | Complexity | Real-World Example |
|---|---|---|---|
| Excel | Small projects, quick planning, budget tracking | Medium (requires setup) | Planning a team offsite with 8 tasks, 3 team members, and a $2,000 budget |
| Project | Large teams, long-term projects, resource allocation | High (advanced features) | Managing a 12-month software rollout across 5 departments |
Excel offers flexibility and integration with financial models. You can embed the chart in a dashboard, link it to budgets, and share it via email. Project handles complex dependencies, resource leveling, and baseline comparisons.
Both tools allow exporting to PDF or PNG for reports. Project supports collaboration via SharePoint or Teams, enabling real-time updates across locations.
Many assume that a microsoft office gantt chart requires advanced training. This is false. Basic versions in Excel take under 15 minutes to set up with a template. The default "Gantt Chart" template in Excel includes predefined columns for task name, start date, end date, duration, and % complete.
Another mistake is treating the chart as a static document. It's not. A properly configured chart updates dynamically. Change a task's start date in Excel, and the bar shifts. In Project, changing a predecessor triggers a recalculation of the entire schedule.
Some users believe only Project can handle dependencies. Excel can too-using formulas like =IF(DependentTaskStart <= CurrentTaskStart, "OK", "Conflict"). While less automated, this method gives full control over logic.
I built a microsoft office gantt chart for a university research grant proposal. The project had 14 tasks over six months, including literature review, data collection, analysis, and manuscript drafting. I used Excel because the team preferred spreadsheets and needed to integrate cost estimates.
Steps taken:
=C2-B2.The final chart showed clear bottlenecks. Task #7 (data entry) took 12 days instead of 5. The chart flagged this delay, prompting a rescheduling of follow-up tasks. The team adjusted timelines and added a backup researcher.
After submission, the grant committee requested a version with milestones. I added markers at key points-"final draft due," "peer review," "submission"-and labeled them with icons. The chart was accepted.
A microsoft office gantt chart is not the same as a Kanban board or a simple calendar. Gantt charts focus on time-based sequencing. Kanban emphasizes workflow stages and task movement. Calendars show events but lack dependency tracking.
Also, a Gantt chart in Office differs from those in free tools like Google Sheets or Trello. Office versions offer deeper integration with Word, PowerPoint, and Outlook. You can link a task to a meeting invite or attach a report file directly.
One non-obvious fact: Excel's Gantt chart relies on a fixed date system. If you change the workbook's date format (e.g., from mm/dd/yyyy to dd/mm/yyyy), the chart may misalign unless you reset the axis. Always verify date settings before sharing.
Use a microsoft office gantt chart to visualize task flow, identify delays early, and communicate plans. Whether managing a small event or a multi-phase product launch, it turns abstract timelines into actionable insights.