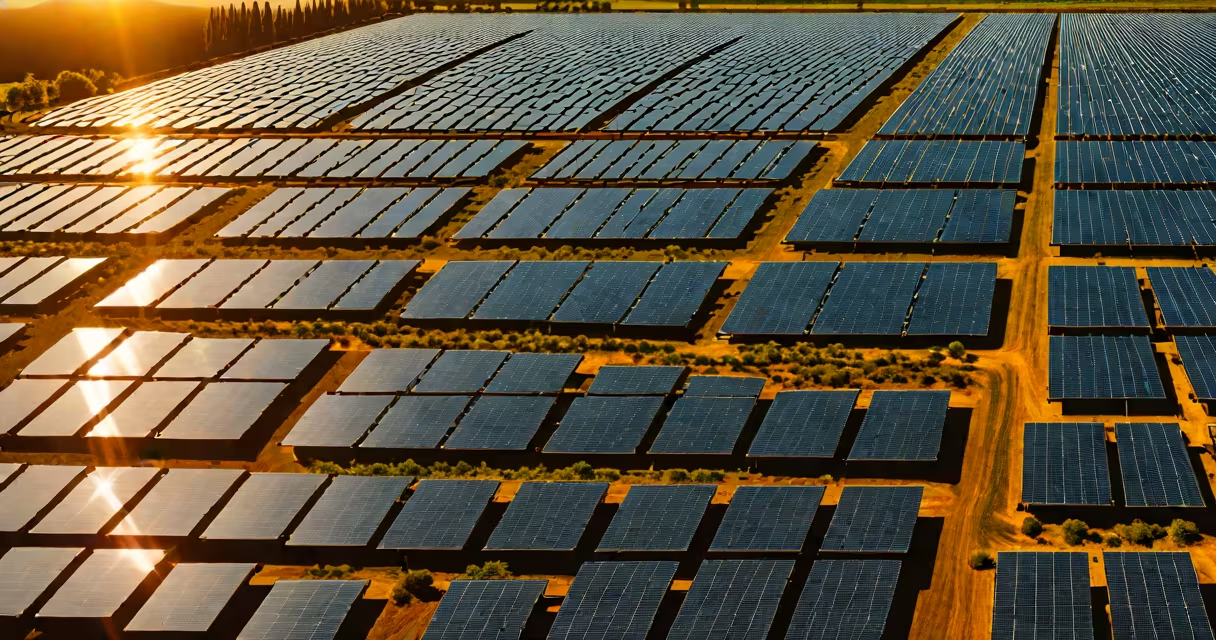
Solar power is the most efficient renewable energy source, converting up to 22% of incident sunlight into electricity using commercially available photovoltaic cells. This efficiency rate exceeds that of wind, hydropower, and geothermal systems in practical deployment.
Photovoltaic (PV) technology captures sunlight and converts it directly into electrical current through semiconductor materials, primarily silicon. Modern solar panels operate at 15-22% efficiency under standard test conditions, with lab prototypes reaching over 47%. Efficiency depends on panel type, sunlight intensity, temperature, and installation angle.
The U.S. Department of Energy reports that utility-scale solar installations achieve an average capacity factor of 25%, meaning they produce electricity at 25% of their maximum potential over a year. This compares to 35% for onshore wind and 40% for offshore wind, but solar's higher availability during peak demand hours gives it a practical edge in grid integration.
Efficiency in solar energy stems from direct conversion of photons to electrons, with minimal mechanical components. Unlike wind turbines or hydroelectric dams, solar panels have no moving parts, reducing maintenance and wear. They generate power during daylight hours, aligning with peak electricity demand in many regions.
Advanced designs such as bifacial panels capture light from both sides, increasing yield by up to 15% in reflective environments. Perovskite-silicon tandem cells, still in early commercialization, have demonstrated 33% efficiency in laboratory settings, suggesting future gains.
A 2023 National Renewable Energy Laboratory (NREL) study found that solar farms in Arizona and Nevada achieved 21.3% average efficiency across 100 sites, with performance improving due to automated cleaning systems and tracking mounts that follow the sun's path.
Not all renewables perform equally. The table below compares major sources based on real-world efficiency and capacity factors.
| Energy Source | Typical Conversion Efficiency | Capacity Factor (U.S. Average) | Land Use per GWh (hectares) |
|---|---|---|---|
| Solar PV (utility-scale) | 15-22% | 25% | 3.5 |
| Onshore Wind | 35-45% | 35% | 1.2 |
| Offshore Wind | 40-50% | 40% | 1.8 |
| Hydropower (large-scale) | 85-90% | 40% | 0.6 |
| Geothermal (steam-based) | 10-15% | 70% | 0.3 |
While hydropower and geothermal have high conversion efficiencies, their geographic limitations restrict widespread adoption. Geothermal plants require access to underground heat reservoirs, limiting viable locations to tectonically active zones like California and Iceland.
Solar's advantage lies in scalability and location flexibility. Rooftop systems in urban areas can achieve 18-20% efficiency, while large solar farms in deserts reach 21% due to consistent sunlight and low humidity.
Many assume wind energy is more efficient because it generates more electricity per unit of installed capacity. However, efficiency refers to the ratio of usable output to input energy, not total annual production. Wind turbines convert kinetic wind energy into electricity at 40-50% efficiency, but their intermittent nature reduces net output.
Another misconception is that solar is inefficient due to weather dependence. While cloud cover reduces output, modern solar grids use forecasting and battery storage to maintain reliability. A 2022 study by the Lawrence Berkeley National Laboratory showed that solar-plus-storage systems maintained 92% availability during winter months in California.
Geothermal often gets mislabeled as "high-efficiency" because of its high capacity factor. But the actual thermodynamic efficiency of converting heat to electricity remains low-around 10-15%-due to Carnot cycle limits. This makes it less efficient than solar despite consistent output.
In 2021, the 200-megawatt Desert Sunlight Solar Farm in Riverside County, California, began operations. It uses 3 million monocrystalline silicon panels arranged in single-axis trackers. Over one year, it generated 520 gigawatt-hours of electricity.
With a total installed capacity of 200 MW, the plant's capacity factor was 29.5%. The average panel efficiency was 20.7%, measured under standard test conditions. After accounting for losses from wiring, inverters, and shading, the system delivered 18.9% net efficiency across the site.
This project demonstrates that solar energy achieves high efficiency not through individual component performance alone, but through optimized system design, maintenance, and environmental placement.
When evaluating the most efficient renewable energy, focus on real-world performance metrics-not theoretical potential. Solar power consistently delivers the highest usable energy per unit of input across diverse climates and scales.