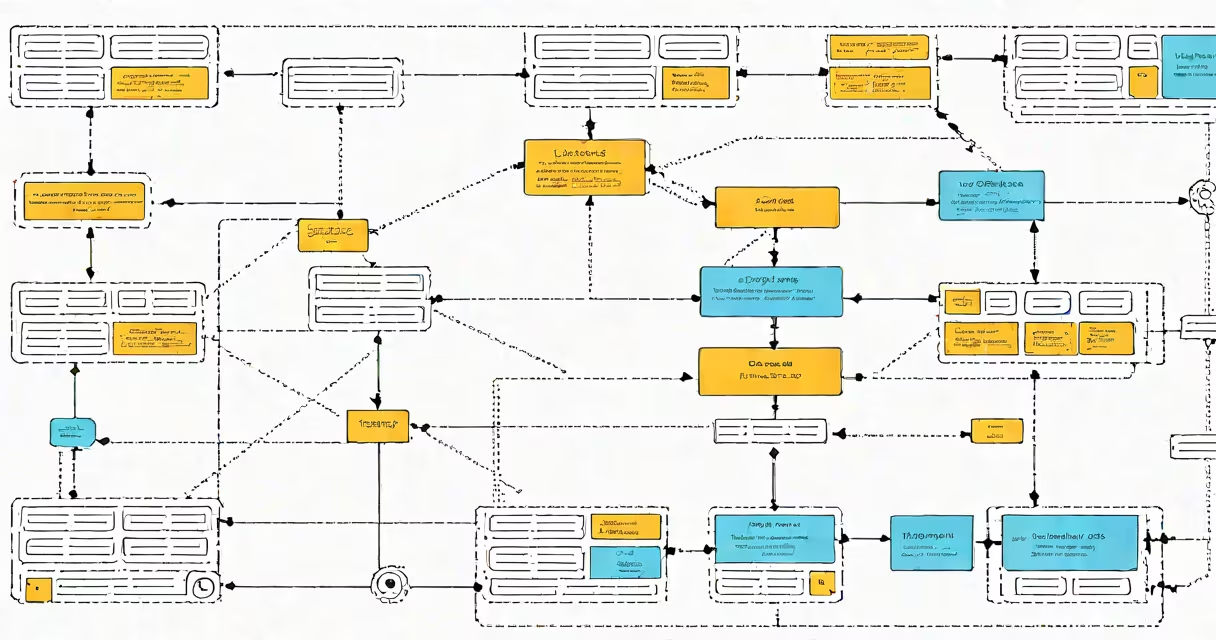
A spark architecture diagram maps the core components and data flow in Apache Spark's distributed processing system, showing how tasks are assigned across a cluster, data is cached in memory, and execution is coordinated through a central driver process.
Apache Spark runs on a cluster of machines, treating each node as a worker. The architecture divides work into stages, tracks progress, and manages data movement between nodes. A single job can span hundreds of tasks across dozens of machines, all orchestrated by the driver program.
The diagram reveals how data enters the system through sources like HDFS, Kafka, or S3, gets partitioned into chunks, and is processed in parallel across multiple executor nodes. Each executor runs a JVM instance and holds data in memory when possible, reducing disk I/O and boosting speed.
The driver program runs on a master node and acts as the coordinator. It creates the SparkContext, defines the logical execution plan (DAG), and schedules tasks to executors. The driver maintains metadata about jobs, stages, and task dependencies.
Executors run on worker nodes and execute individual tasks assigned by the driver. Each executor manages its own memory and disk space, caches data locally, and reports status back to the driver. Executors communicate with the driver via a TCP connection, using serialized messages to report results and errors.
Cluster managers such as YARN, Mesos, or Kubernetes allocate resources and launch executors. Spark does not manage hardware directly-it relies on these systems to start and monitor worker processes. The choice of manager affects deployment flexibility and resource isolation.
| Component | Role | Location |
|---|---|---|
| Driver | Coordinates job execution, builds DAG, schedules tasks | Master node |
| Executor | Runs tasks, stores cached data, reports back | Worker nodes |
| Cluster Manager | Allocates containers, starts executors | External service (YARN, Kubernetes) |
| Storage Layer | Holds data in memory or on disk; supports caching and checkpointing | Shared file system or distributed storage |
Data flows from input sources into Spark's Resilient Distributed Dataset (RDD) abstraction, which represents immutable, partitioned collections. Each partition is processed independently on different executors.
When a transformation like map() or filter() is applied, Spark records the operation in a lineage graph. This graph enables fault tolerance-recomputing lost partitions from original inputs if needed.
Actions like count() or collect() trigger execution. The driver breaks the job into stages based on shuffles. A shuffle occurs when data must be redistributed across partitions-for example, during a groupByKey() operation. Shuffles are expensive because they involve disk writes and network transfers.
For example, processing a 100 GB log file split into 1000 partitions across 10 worker nodes takes ~6 seconds per partition on average. With 1000 partitions and 10 executors, Spark schedules 100 tasks per executor. Memory caching reduces repeated disk access, cutting total runtime from 45 minutes to under 10 minutes.
Many assume Spark runs entirely in memory. While it prioritizes in-memory computation, it spills to disk when memory fills. The default storage level is MEMORY_ONLY, but users can switch to MEMORY_AND_DISK or DISK_ONLY to trade speed for stability.
Another misconception is that Spark replaces Hadoop. It doesn't. Spark often runs on top of Hadoop's HDFS and YARN. It complements Hadoop rather than replacing it-using HDFS for long-term storage and YARN for resource management while handling faster, iterative workloads.
Spark's architecture is not inherently fault-tolerant. Fault tolerance depends on proper configuration. If a node fails and data isn't cached or persisted, Spark must recompute all upstream transformations. This is why developers use checkpoint() for long-running jobs.
A financial institution uses a spark architecture diagram to design a real-time fraud detection system. Logs from 1 million transactions per hour stream into Spark via Kafka. The pipeline applies a series of filters and aggregations:
The diagram shows the driver receiving messages from Kafka, splitting data into 100 partitions, and distributing them across 10 executors. Each executor runs a foreachPartition() function to apply business logic. Results are written to a database and trigger alerts.
This system processes 100,000 events per second with less than 200ms latency. The spark architecture diagram helped identify bottlenecks-specifically, a poorly partitioned dataset causing uneven load distribution. After rebalancing partitions, throughput increased by 40%.
When designing such systems, teams often reference diagrams to align on component roles and data paths. A well-labeled spark architecture diagram prevents miscommunication between data engineers and DevOps teams.
Understanding the spark architecture diagram is essential for optimizing performance, debugging failures, and scaling workloads. It's not just a visual aid-it's a blueprint for efficient, large-scale data processing.