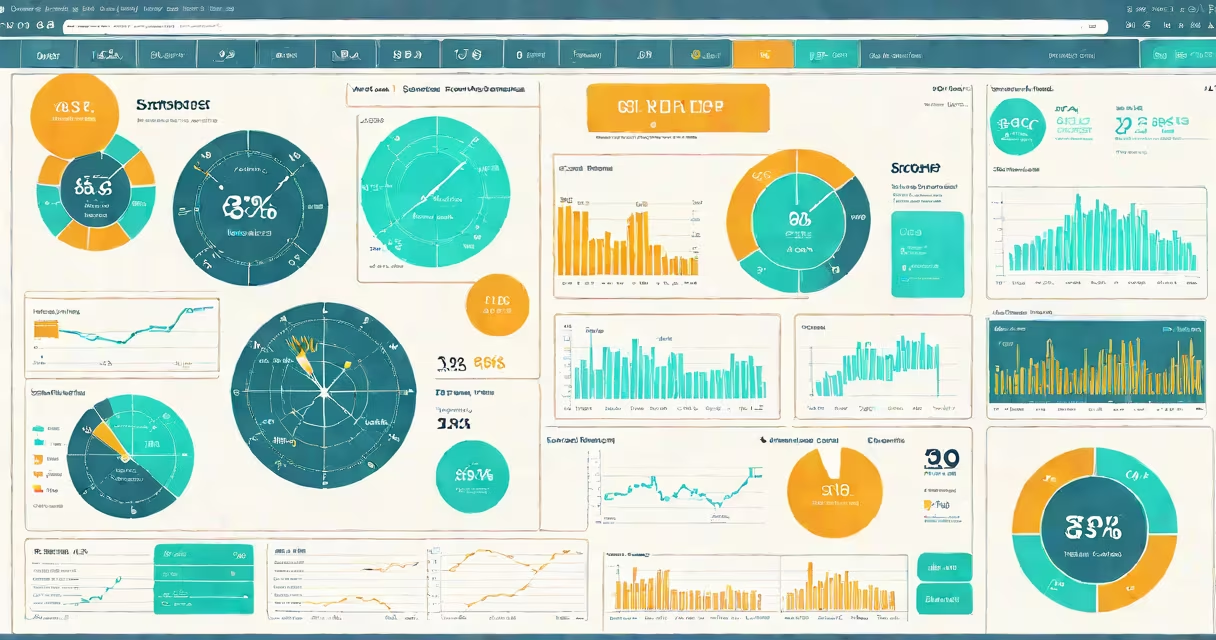
Business intelligence systems are integrated software platforms that collect, analyze, and visualize organizational data to support strategic decision-making. They change raw transactional data into reports, dashboards, and predictive models used across departments.
These systems ingest data from multiple sources-sales databases, customer relationship management (CRM) tools, inventory systems, and financial ledgers-then process it through predefined logic to generate insights. A retail chain might use a BI system to track daily sales by store, compare regional performance, and forecast demand based on seasonal trends.
According to Gartner, organizations using mature BI capabilities report 27% higher decision quality than those relying on manual analysis. The International Data Corporation (IDC) notes that 60% of enterprises now deploy cloud-based BI solutions to improve scalability and reduce infrastructure costs.
BI systems follow a structured pipeline: data ingestion, transformation, storage, analysis, and visualization. Each stage serves a distinct function in turning unstructured or siloed data into usable intelligence.
Data enters the system via APIs, ETL (extract, change, load) processes, or direct database connections. For example, a logistics company pulls shipment tracking data from GPS-enabled delivery vehicles and integrates it with warehouse inventory records. The system cleans the data-removing duplicates, correcting formatting errors-and stores it in a data warehouse or data lake.
Once stored, users apply analytical functions such as aggregation, trend detection, and anomaly identification. A marketing team might run a query to identify which customer segments show the highest retention rates after a campaign. The results appear in a dashboard with charts, heat maps, or drill-down tables.
Modern BI systems consist of five core elements: data sources, ETL pipelines, data storage, analytical engines, and visualization layers. Each component plays a role in delivering accurate, timely insights.
| Type | Function | Example Use Case |
|---|---|---|
| Descriptive Analytics | Summarizes past performance | Monthly revenue report by region |
| Diagnostic Analytics | Explains why something happened | Identifying drop in website conversions during a server outage |
| Predictive Analytics | Forecasts future outcomes | Estimating next quarter's product demand based on historical sales and market trends |
| Prescriptive Analytics | Suggests optimal actions | Recommending reorder points for inventory based on predicted demand and supplier lead times |
While descriptive and diagnostic analytics are widely adopted, prescriptive analytics remains less common due to complexity and data quality requirements. A 2023 McKinsey study found that only 18% of companies using advanced BI tools implement prescriptive features effectively.
Many assume BI systems are synonymous with dashboards or reporting tools. That's incorrect. While dashboards are a visible output, the system includes backend processing, data governance, and metadata management. A dashboard without proper data validation can mislead users.
Another misconception is that BI systems require massive IT teams to operate. Modern cloud BI platforms like Power BI, Tableau, and Looker allow business analysts and non-technical staff to build reports using drag-and-drop interfaces. At a mid-sized e-commerce firm, a marketing specialist created a customer churn analysis dashboard in under two hours using pre-built connectors and templates.
A lesser-known fact: BI systems often rely on data lineage tracking. This feature logs where each data element originated, how it was transformed, and who accessed it. Without lineage, audits and compliance checks fail. The U.S. Securities and Exchange Commission (SEC) requires public companies to maintain audit trails for financial data used in reporting-many use BI systems to automate this.
Consider a national fitness equipment retailer with 120 stores. Management wants to understand why sales dropped 14% in Q2 compared to Q1. The company uses a BI system to investigate.
Step 1: The system pulls data from the point-of-sale (POS) system, CRM, and supply chain database. It aggregates daily sales figures by store, product category, and salesperson.
Step 2: The analyst runs a drill-down query filtering for stores in the Northeast region. The results show a 22% decline in treadmill sales, particularly in urban locations.
Step 3: The system cross-references this with weather data and local events. It identifies that two major snowstorms occurred in March and April, reducing foot traffic. It also flags that a competitor launched a promotional campaign targeting the same demographic.
Step 4: The dashboard displays a time-series chart comparing sales trends, overlaying storm dates and competitor promotions. The team adjusts inventory allocation and launches targeted email campaigns to affected areas.
This scenario illustrates how BI systems go beyond data presentation-they enable root cause analysis and action planning. The retailer restored sales growth within six weeks.