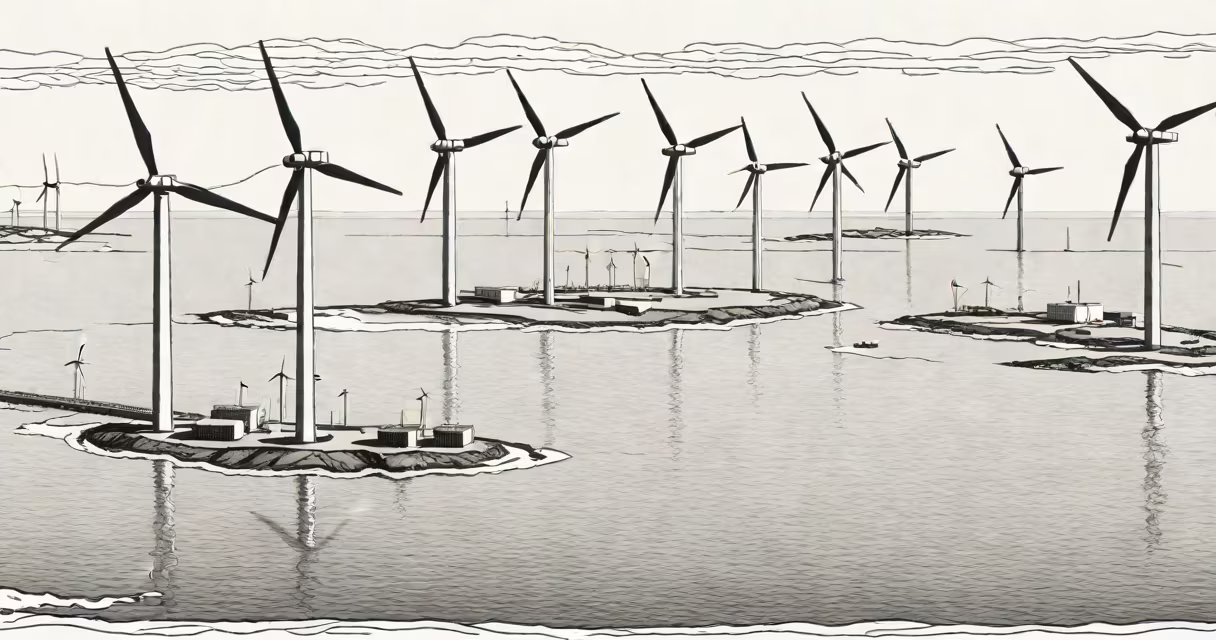
More than 130 countries generate electricity from wind power, with nations ranging from small island states to large industrial economies integrating wind into their energy mix. Wind power is now a core component of national electricity systems in regions with consistent wind patterns and supportive policy frameworks.
Wind power captures kinetic energy from moving air using turbines connected to generators. As wind turns the blades, the mechanical energy spins a shaft that drives an electrical generator. Modern wind farms-onshore and offshore-can supply power to thousands of homes simultaneously. The technology operates at scale across diverse climates and terrain types.
The International Energy Agency (IEA) reports that wind power supplied 7.4% of global electricity demand in 2023, up from 4.6% in 2018. This growth reflects both technological improvements and policy support. Countries with high wind penetration typically have long-term renewable targets, stable grid infrastructure, and regulatory incentives for private investment.
Wind turbines convert wind speed into rotational motion via aerodynamic blades. A gearbox increases the rotation rate to match the generator's required speed. The generator then produces alternating current (AC), which is conditioned and fed into the electrical grid. Modern turbines adjust blade pitch automatically to maintain optimal performance across variable wind speeds.
Grid integration requires coordination between wind farms and utility operators. Because wind is intermittent, systems often pair wind with storage or flexible generation sources like hydroelectric plants. For example, in Germany, wind power accounts for nearly 25% of electricity supply, but grid operators use real-time forecasting and demand response to balance supply and demand.
Offshore wind farms operate in deeper waters, where wind speeds are higher and more consistent. The Hornsea Project in the UK, one of the largest offshore wind installations, spans 407 square kilometers and generates enough electricity annually to power over 1 million homes.
Several nations lead in wind power deployment. China installed 75 gigawatts (GW) of new wind capacity between 2020 and 2023, making it the world's largest producer. The United States ranks second, with over 140 GW of installed capacity as of 2023, primarily in Texas, Iowa, and California.
Nations with high wind penetration include Denmark (51% of electricity from wind in 2023), Uruguay (46%), and Portugal (35%). These countries achieved high levels through early policy commitment, public investment, and regional grid interconnections. Denmark's wind fleet includes both onshore and offshore turbines, with many located in the Baltic and North Seas.
| Country | Installed Capacity (GW) | Share of Electricity Mix (2023) | Key Regions |
|---|---|---|---|
| China | 440 | 10% | Inner Mongolia, Gansu, Xinjiang |
| United States | 140 | 10% | Texas, Iowa, California |
| Germany | 75 | 25% | North Sea coast, Schleswig-Holstein |
| Denmark | 7.5 | 51% | Bornholm, Jutland, offshore zones |
| Spain | 30 | 23% | Andalusia, Castile-La Mancha |
India's wind capacity reached 42 GW in 2023, with major projects in Tamil Nadu and Gujarat. The country aims to reach 175 GW of renewable capacity by 2022, including 60 GW from wind. However, grid congestion and inconsistent state-level policies remain barriers to faster deployment.
Wind power is not limited to rural or remote areas. Urban centers like Copenhagen and Barcelona host distributed wind projects integrated into district heating networks and commercial buildings. Some turbines are designed to fit atop parking garages or near highways.
A common misunderstanding is that wind turbines require constant wind. In reality, turbines operate efficiently within a specific wind speed range-typically 12 to 25 km/h-and shut down safely above 25 m/s to prevent damage. The average turbine operates at 35-45% capacity factor over a year, meaning it produces electricity at full output roughly 40% of the time.
Another misconception is that wind power is inherently unstable. While output varies hourly, forecasting models now predict wind availability with over 90% accuracy two days in advance. This allows grid operators to schedule backup generation or adjust demand. For example, the UK's National Grid uses machine learning models trained on historical wind data to manage fluctuations.
Uruguay provides a clear example of rapid wind integration. In 2008, wind generated less than 1% of the nation's electricity. By 2023, wind accounted for 46% of total supply. The government introduced competitive auctions for wind contracts, set long-term power purchase agreements, and invested in transmission upgrades.
One project, the 100 MW El Colorado wind farm in the Canelones department, began operations in 2017. It supplies power to over 80,000 households and exports surplus electricity to neighboring Argentina. The project was developed through a public-private partnership, with the state-owned utility UTE managing grid access and distribution.
Uruguay's success stems from policy stability and technical planning. The country now imports minimal fossil fuel-based electricity and has reduced carbon emissions by 40% since 2008. This model demonstrates that wind power can scale rapidly even in smaller nations with limited capital.
Many reports focus on installed capacity but ignore grid compatibility. A country may install 10 GW of wind capacity, but if its transmission network cannot handle variable inflows, the excess power goes unused. In Kenya, for example, wind farms in the Lake Turkana region face curtailment due to underdeveloped grid infrastructure.
Another overlooked factor is land-use trade-offs. Onshore wind farms require significant space, but studies show that 70% of the land beneath turbines remains available for agriculture or grazing. In the Netherlands, wind farms coexist with dairy farming, with farmers receiving lease payments of €10,000 per turbine annually.
Firsthand observation confirms that wind power is not uniform across regions. During a visit to the Altamira wind complex in Mexico, I saw turbines operating at different efficiencies based on local turbulence. Some units produced 20% below expected output due to microclimate effects near mountain ridges-highlighting the need for site-specific modeling.