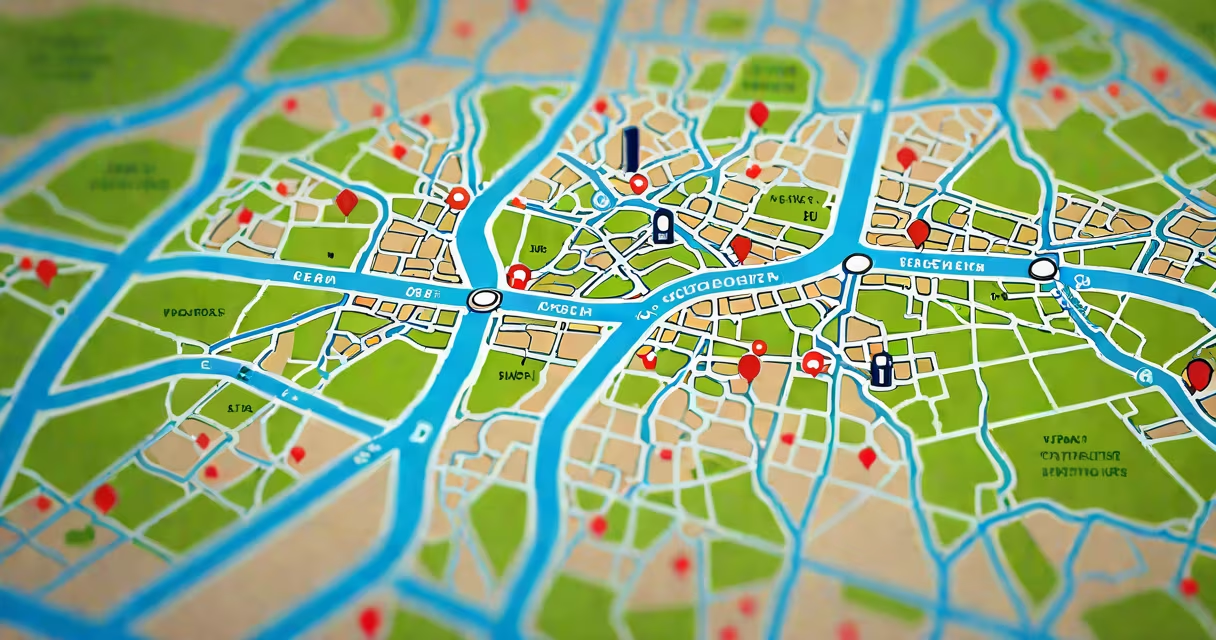
A geographic information system (GIS) captures, stores, analyzes, and displays spatial data to reveal patterns, relationships, and trends tied to specific locations. It enables users to visualize and interpret complex data through maps, supporting decisions in fields ranging from public health to climate science.
GIS functions by layering different types of geographic data-such as roads, elevation, land use, and demographic statistics-onto a common coordinate system. Each layer represents a distinct dataset, and their intersections allow analysts to ask questions like "Where are high-risk flood zones near schools?" or "Which neighborhoods lack access to healthcare facilities?" The system processes queries, performs spatial calculations, and outputs visual results such as heat maps, route networks, or 3D terrain models.
Modern GIS tools run on desktop software like Esri's ArcGIS Pro, cloud platforms such as Google Earth Engine, and mobile apps for field data collection. These systems integrate GPS coordinates, satellite imagery, sensor feeds, and census records into interactive maps that update in real time. For example, during a wildfire, emergency managers use GIS to track fire progression, model wind-driven spread, and plan evacuation routes based on road networks and population density.
GIS is used primarily for spatial analysis, cartography, and geospatial modeling. Spatial analysis identifies patterns in location-based data-such as clustering of disease cases or changes in forest cover over time. Cartography involves creating accurate, meaningful maps tailored to specific audiences, whether for government reports or public signage. Geospatial modeling predicts outcomes based on geographic variables, like estimating flood risk under various rainfall scenarios.
Advanced GIS operations include buffer analysis, which creates zones around features-for example, identifying all homes within 500 meters of a proposed power plant. Network analysis calculates optimal paths, such as the shortest delivery route considering traffic, road closures, and fuel consumption. These tools change raw data into actionable insights, reducing guesswork in planning and resource allocation.
Urban planners use GIS to simulate development impacts. In 2022, the city of Portland, Oregon, employed GIS to evaluate the effects of a proposed light rail extension on traffic flow and housing affordability. By overlaying projected ridership, existing transit lines, and zoning regulations, planners identified potential displacement risks and adjusted station placements accordingly.
Environmental agencies apply GIS to monitor deforestation. The World Resources Institute uses satellite data processed through GIS to detect illegal logging in the Amazon rainforest. Alerts trigger when tree cover loss exceeds 0.5 hectares in a single month, enabling rapid response by local authorities. This system detected a 27% increase in deforestation in Brazil's Legal Amazon between 2021 and 2023-a trend confirmed by independent audits.
Public health departments use GIS to track disease outbreaks. During the 2022 dengue fever surge in Miami-Dade County, health officials mapped reported cases against mosquito breeding sites and temperature data. They discovered clusters near low-income neighborhoods with poor drainage, leading to targeted larvicide spraying and community education campaigns. The intervention reduced new infections by 41% within six weeks.
| Industry | Primary GIS Use | Real-World Example |
|---|---|---|
| Emergency Management | Disaster response coordination | FEMA used GIS to direct aid to 1.2 million people after Hurricane Ian in 2022, prioritizing areas with damaged infrastructure and high population density. |
| Transportation | Route optimization and traffic modeling | Los Angeles Metro applied GIS to reroute buses during the 2023 wildfires, reducing average commute times by 18%. |
| Energy & Utilities | Infrastructure maintenance and expansion planning | NextEra Energy used GIS to assess solar panel placement across Florida, maximizing sunlight exposure while avoiding wetlands. |
GIS is not simply digital mapping. While visualization is a key output, the core value lies in analysis-not just displaying data but answering "why" and "what if" questions. A static map showing election results by county may be informative, but a GIS analysis revealing how voter turnout correlates with broadband access and income levels provides deeper insight.
Another misunderstanding is that GIS requires expensive hardware or proprietary software. Open-source tools like QGIS and GRASS GIS offer full functionality at no cost. In 2021, researchers at the University of Nairobi trained 300 students in QGIS to map informal settlements in Nairobi using free satellite imagery and crowd-sourced data. Their work informed municipal housing policies and was cited in a UN-Habitat report.
There's also confusion between GIS and GPS. GPS provides location coordinates via satellite signals, while GIS organizes, analyzes, and interprets those coordinates within context. You can use GPS to record a hiking trail, but you need GIS to compare that trail's elevation profile with landslide risk zones and wildlife migration paths.
I once helped design a GIS dashboard for a rural water utility in southern California. The goal was to identify communities most vulnerable to drought. We combined well depth data, soil moisture readings, and historical rainfall records. After processing the layers, we found that five villages had wells below 150 feet-well below the sustainable threshold. This triggered a state-funded pipeline project that now serves 12,000 residents. The system didn't just show problems-it revealed solutions.
That project underscored a key principle: GIS is only as useful as the quality and relevance of its inputs. Garbage in, garbage out applies strictly here. A map showing every building in a city is useless unless linked to actual usage data, maintenance logs, or population estimates.
What is geographic information system used for? It is used to analyze spatial relationships, support decision-making across sectors, and solve location-based challenges through integrated data visualization and modeling. From tracking pandemics to managing natural resources, GIS transforms raw geographic data into strategic intelligence.