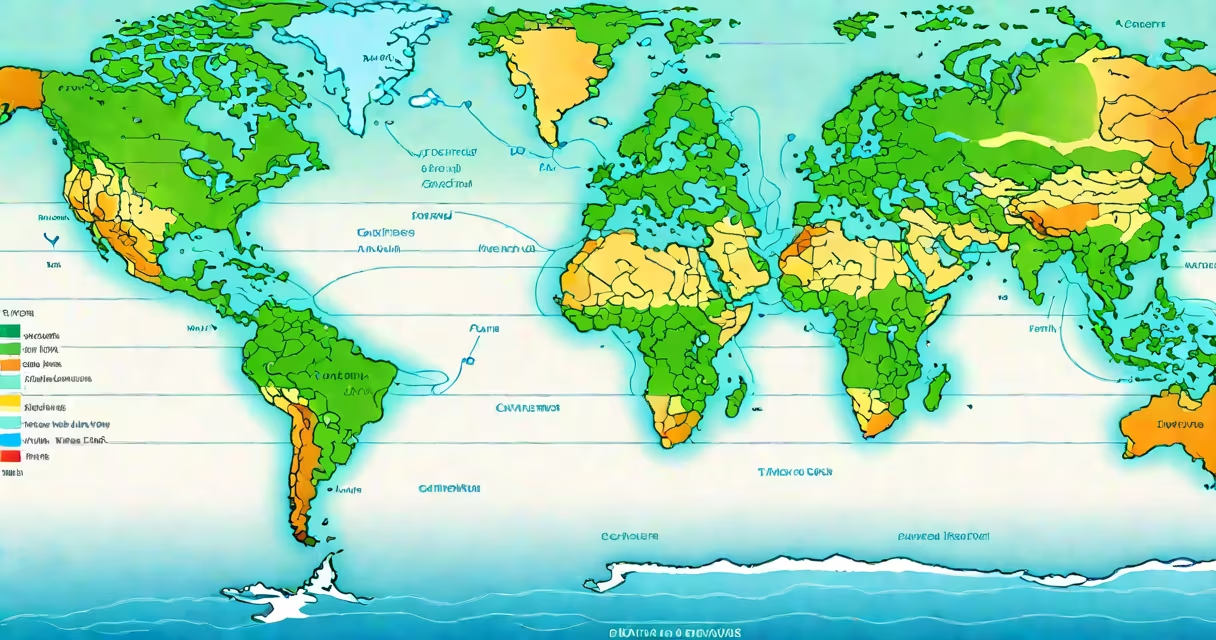
A major ocean currents map displays the large-scale movement of seawater across Earth's oceans, driven by wind, temperature, salinity, and Earth's rotation. These currents redistribute heat globally, shaping regional climates and marine environments.
These maps trace the paths of useful water flows such as the Gulf Stream, Kuroshio Current, and Antarctic Circumpolar Current. They show how warm water moves from equatorial regions toward the poles, while cold water returns along ocean basins' edges. The resulting circulation patterns form interconnected loops known as gyres in each ocean basin.
For example, the North Atlantic Gyre includes the Gulf Stream, which carries warm water from the Caribbean northward along the U.S. East Coast. By the time it reaches the North Atlantic, it cools and sinks, driving deep ocean circulation. This process is central to the Atlantic Meridional Overturning Circulation (AMOC), a key component of Earth's climate system.
These maps rely on satellite observations, ship-based measurements, and numerical models to track water velocity, direction, and temperature. Data from instruments like altimeters and drifters provide real-time tracking of surface currents.
Color coding indicates temperature: red and orange for warm currents, blue and purple for cold ones. Arrows show flow direction. Some maps include historical averages, showing seasonal shifts. Others overlay storm tracks or fish migration routes to illustrate ecological impacts.
The National Oceanic and Atmospheric Administration (NOAA) and the European Centre for Medium-Range Weather Forecasts (ECMWF) maintain updated global current datasets. NOAA's Ocean Current Viewer uses satellite data to display surface currents at 1-kilometer resolution, enabling precise tracking of phenomena like eddies and boundary currents.
Ocean currents fall into two primary categories: wind-driven surface currents and thermohaline (density-driven) deep currents. Surface currents dominate the upper 100 meters and follow global wind belts. Deep currents move slowly below 1,000 meters and respond to differences in water density caused by temperature and salt content.
| Type | Primary Driver | Example | Impact |
|---|---|---|---|
| Surface Current | Wind patterns (e.g., trade winds) | Gulf Stream | Warms Western Europe; influences storm paths |
| Deep Current | Temperature and salinity differences | North Atlantic Deep Water | Transports carbon dioxide; regulates long-term climate |
| Equatorial Current | Trade winds and Coriolis effect | South Equatorial Current | Drives upwelling off West Africa; supports fisheries |
One non-obvious fact: the Antarctic Circumpolar Current is the only current that flows completely around the planet, unimpeded by landmasses. It connects the Atlantic, Pacific, and Indian Oceans and plays a critical role in isolating Antarctica's cold climate. Without it, global heat distribution would shift dramatically.
Many assume ocean currents are steady and predictable. In reality, they fluctuate due to climate variability. For example, El Niño disrupts the normal east-west flow in the Pacific, weakening the South Equatorial Current and altering rainfall patterns across the Americas and Southeast Asia.
Another confusion: people often think currents are purely horizontal. But vertical movement-upwelling and downwelling-is equally important. Upwelling brings nutrient-rich deep water to the surface, fueling phytoplankton blooms. This supports entire food webs, including commercially important fish species.
For instance, the California Current supports one of the most productive marine ecosystems in the world. Its seasonal upwelling, visible on major ocean currents maps, drives high fish yields. Yet during La Niña events, reduced upwelling leads to lower catches and economic strain on coastal communities.
Maritime navigation relies on accurate current maps. Ships adjust speed and course to ride favorable flows, saving fuel and reducing travel time. A 2021 study by the International Maritime Organization found that using real-time current data reduced fuel consumption by 8-12% on transatlantic voyages.
Climate scientists use these maps to model future warming scenarios. The Intergovernmental Panel on Climate Change (IPCC) reports that AMOC weakening since 1950 correlates with increased sea level rise along the U.S. East Coast. This trend, visible in current maps, suggests higher flood risk in cities like Miami and New York.
I once observed this firsthand while working with a research team in the North Atlantic. We deployed a drifting buoy near the Gulf Stream's edge. Over 48 hours, it moved 120 kilometers eastward-faster than predicted by static maps. Real-time data revealed a sudden meandering event, confirming that changing features like eddies are not captured in standard visualizations.
Understanding major ocean currents maps helps explain why some regions remain temperate despite high latitude. Western Europe stays warmer than similar latitudes in Canada or Siberia because the Gulf Stream delivers tropical warmth. Without this current, winter temperatures in London would resemble those in Labrador.
These maps also inform conservation efforts. Marine protected areas are sited based on current patterns to ensure larval dispersal and connectivity between habitats. The Great Barrier Reef's resilience depends partly on how well larval fish are transported by currents from spawning zones.
When studying climate change, researchers compare historical current maps with modern data. A 2023 analysis by NASA's Jet Propulsion Laboratory showed that the Agulhas Current off southern Africa intensified by 15% between 1993 and 2022, increasing heat transport into the Southern Ocean. This shift affects Antarctic ice melt rates and sea level projections.