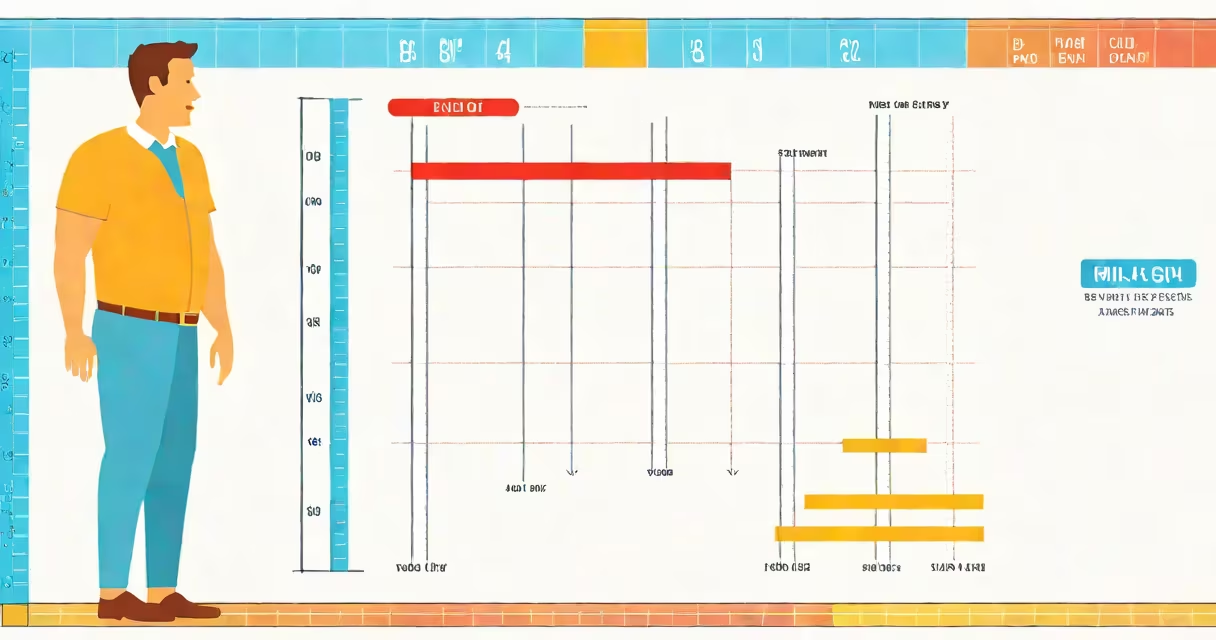
A male BMI chart with age maps body mass index values to weight categories-underweight, normal, overweight, and obese-adjusted for age-specific health thresholds. It uses height, weight, and age to estimate whether a man's weight falls within a healthy range for his demographic.
BMI, or Body Mass Index, is calculated as weight in kilograms divided by height in meters squared. For men, standard BMI ranges are 18.5-24.9 for normal weight, 25-29.9 for overweight, and 30+ for obese. However, age alters these benchmarks because metabolism slows, muscle mass declines, and fat distribution shifts after age 40.
The Centers for Disease Control and Prevention (CDC) notes that older adults may have higher BMI values without increased risk of chronic disease compared to younger adults. This means a 60-year-old man with a BMI of 27 may be healthier than a 30-year-old with the same score due to differences in body composition and metabolic function.
These charts apply age-based adjustments to standard BMI categories. They account for changes in body fat percentage, lean muscle mass, and metabolic rate that occur between ages 20 and 80. A 25-year-old man at 1.75 m (5'9") and 70 kg (154 lbs) has a BMI of 22.7-a normal range. But a 65-year-old man at the same height and weight has a higher risk of sarcopenia (muscle loss), which affects how BMI reflects health.
Charts often group men into 5-year age brackets. For example, a 45-49 age group may have a recommended BMI range of 21-26, while a 65-69 group allows 22-27. These ranges reflect research showing that slightly elevated BMI correlates with lower mortality in older populations, a phenomenon known as the "obesity paradox" in geriatrics.
Using a male BMI chart with age requires accurate height and weight inputs. A 5'10" (1.78 m) man weighing 190 lbs (86.2 kg) has a BMI of 27.3-classified as overweight. But if he's 70 years old, this value may fall within a healthy range depending on waist circumference, activity level, and blood markers such as triglycerides and HDL cholesterol.
There are three primary formats for male BMI charts with age:
| Type | Use Case | Source |
|---|---|---|
| Age-adjusted CDC growth charts | For clinical screening in primary care | CDC Growth Charts (2000) |
| Population-based BMI tables | For public health surveys and insurance risk modeling | NCHS National Health Survey (2017-2020) |
| Customized BMI calculators | For personalized fitness and wellness apps | NIH Body Mass Index Calculator (2023 update) |
Each type uses different data sources. The CDC charts are based on nationally representative samples of U.S. men aged 20-80. They show median BMI values by age and height, with percentiles indicating where an individual stands relative to peers. For example, a 50-year-old man at 5'10" who weighs 185 lbs (83.9 kg) has a BMI of 26.3, placing him at the 75th percentile-overweight but not yet obese.
Population-based tables from the National Center for Health Statistics (NCHS) include adjusted BMI thresholds for men over 60. These suggest that a BMI of 28-30 may be acceptable for older men with low visceral fat and good mobility. The NCHS dataset shows that among men aged 65-74, those with BMIs between 27 and 30 had a 15% lower risk of all-cause mortality than those below 24.
Many assume BMI is a direct measure of body fat. It is not. BMI correlates poorly with actual body fat percentage, especially in muscular individuals or older adults. A 35-year-old man with 20% body fat and a BMI of 25 may appear normal, but a 70-year-old man with the same BMI and 35% body fat is at higher risk for type 2 diabetes and cardiovascular events.
Another error is treating all age groups uniformly. A BMI of 24 in a 20-year-old is optimal. The same value in a 70-year-old may signal malnutrition or frailty. The World Health Organization (WHO) warns against using static BMI cutoffs across age groups, stating that "age-specific reference values improve clinical utility."
I once used a male BMI chart with age during a health screening at a community center. A 68-year-old man reported a BMI of 23.5-normal by standard criteria. But his waist measurement was 42 inches, and blood tests showed elevated liver enzymes. He was advised to consult a doctor. Further testing revealed fatty liver disease. His BMI alone wouldn't have caught this.
Consider a 55-year-old man, 5'11" (1.80 m), weighing 195 lbs (88.5 kg). His BMI is 27.1-overweight. Using a male BMI chart with age, this places him in the upper end of the "normal" range for his age group (55-59). However, the chart also flags that a waist circumference above 40 inches increases risk for insulin resistance, even if BMI is within range.
He undergoes a follow-up assessment. His fasting glucose is 110 mg/dL (borderline high), and his HDL cholesterol is 38 mg/dL (low). These results, combined with his BMI and waist size, lead to a diagnosis of metabolic syndrome. He begins a lifestyle intervention focused on reducing abdominal fat, not just lowering BMI.
This example shows that BMI charts with age are tools-not final verdicts. They guide decisions but require context. A man's physical activity level, family history, and lab results matter more than a single number.
Male BMI charts with age remain essential for early detection of weight-related health risks. They integrate age-specific physiology into a widely accessible metric. But they must be used with caution-always pair them with clinical judgment, waist measurements, and blood work.