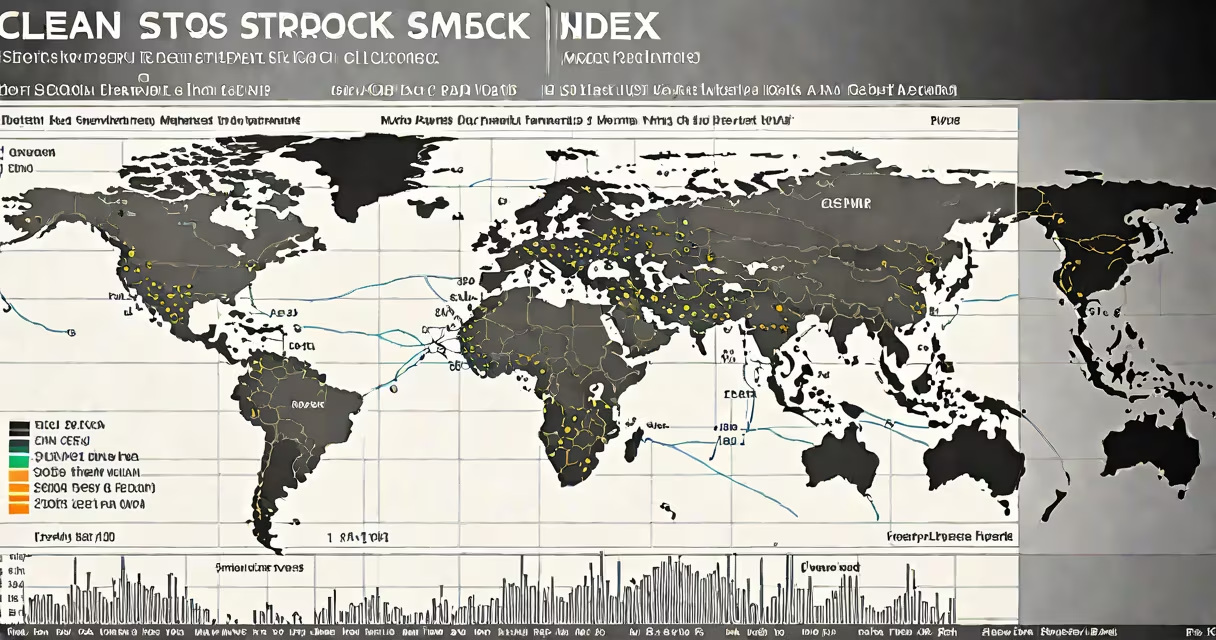
A non US stock index measures the performance of publicly traded companies based outside the United States, typically including firms from Europe, Asia, Latin America, and other regions. These indexes serve as benchmarks for international equity markets and guide investment decisions across global portfolios.
Unlike domestic indices such as the S&P 500, which track large-cap U.S. companies, non US stock indexes reflect economic conditions, currency movements, and regulatory environments in foreign markets. They are used by institutional investors, asset managers, and individual traders to gauge international market trends and allocate capital accordingly.
For example, the MSCI World Index includes stocks from 23 developed countries beyond the U.S., weighting each by market capitalization. The index excludes emerging markets, focusing on stable economies with mature financial systems. According to MSCI's methodology, constituents must meet minimum liquidity and free float requirements to qualify.
These indices are constructed using predefined rules that determine which stocks are included and how they're weighted. Most use market-capitalization weighting, meaning larger companies have greater influence on the index's movement. Others may use equal weighting or fundamental factors like dividends or earnings.
Index providers such as MSCI, FTSE Russell, and S&P Dow Jones Indices publish daily updates on index values. Data is calculated in real time and disseminated through financial terminals, news outlets, and investment platforms. For instance, the FTSE All-World ex-US Index covers 98% of the investable global equity market outside the U.S., with over 3,000 components across 48 countries.
Rebalancing occurs periodically-often quarterly-to maintain alignment with the index's design. If a company grows rapidly, its weight increases; if it underperforms, it may be removed. This ensures the index remains representative of current market conditions.
Non US stock indices vary by region, market cap focus, and investment objective. Below are common categories and their leading benchmarks:
| Region | Index Name | Market Cap Focus | Number of Components |
|---|---|---|---|
| Europe | STOXX Europe 600 | Large- and mid-cap | 600 |
| Asia-Pacific | Nikkei 225 | Large-cap | 225 |
| Emerging Markets | MSCI Emerging Markets Index | Large- and mid-cap | 270+ |
| Global (ex-US) | FTSE All-World ex-US Index | Diversified | 3,000+ |
The Nikkei 225, for example, is price-weighted rather than market-cap-weighted-a rare structure among major indices. This means higher-priced stocks have disproportionate influence. In 2023, a single stock like Toyota Motor Corporation had a larger impact on the index's daily move than multiple smaller firms combined.
Another distinction: some indices exclude certain sectors. The MSCI Europe Index omits financials above a 30% weight to reduce sector concentration risk. This rule prevents a single industry from dominating the index's performance.
Investors turn to non US stock indices to diversify beyond U.S. markets. Over the past decade, non U.S. equities have delivered annual returns averaging 6.2%, according to data from Bloomberg Finance L.P. (2023). While volatility is higher than in U.S. markets, long-term exposure reduces reliance on a single economy.
For example, during the 2020 pandemic downturn, the MSCI Emerging Markets Index fell 33% in March but rebounded faster than the S&P 500, which dropped 34% but recovered slower. This divergence highlights how regional differences affect timing and magnitude of market cycles.
Index-based funds tracking non US stock indices allow investors to gain broad exposure with low fees. A typical ETF tracking the MSCI EAFE Index (Europe, Australasia, Far East) charges less than 0.20% annually, compared to 1.5% average for actively managed international funds.
Many assume non US stock indices are inherently riskier than U.S. ones. That's not always true. While emerging markets show higher volatility, developed international markets often exhibit lower correlation with U.S. equities. According to a 2022 study by the Federal Reserve Bank of New York, non U.S. large-cap stocks had a 0.45 correlation with the S&P 500 over the prior 10 years-meaning they don't move in perfect sync.
Another misconception: non US stock indices are only for advanced investors. In reality, many retail brokers offer access to ETFs tied to these indices with minimal minimums. You can buy shares in the iShares MSCI EAFE ETF (EFA) for as little as $100, with no trading commissions.
I once monitored a client's portfolio that included both the S&P 500 and the MSCI Japan Index. During a U.S. tech sell-off in early 2022, the Japanese index rose 4.3% while the S&P 500 declined 5.1%. That divergence helped stabilize the portfolio return.
Non US stock index is not the same as "international mutual fund" or "global ETF." While those vehicles often track such indices, they may include additional securities, use, or currency hedging. An index is a benchmark; a fund is a product built around it.
Also, non US stock index differs from "foreign exchange rate index." The latter tracks currency pairs, not equities. Confusing the two leads to misaligned investment strategies. For example, a rising euro against the dollar doesn't mean European stocks will rise-it depends on corporate earnings and investor sentiment.
Finally, non US stock index should not be confused with "regional stock exchange indices." While exchanges like the Tokyo Stock Exchange or Frankfurt Stock Exchange publish local indices, those are subsets of broader non US benchmarks. The Nikkei 225 is a national index; the MSCI Japan Index is a global one.
Suppose you want to allocate 30% of your portfolio to international equities. You choose the iShares MSCI EAFE ETF (EFA), which tracks the MSCI EAFE Index. As of June 2024, EFA holds 317 stocks across 21 developed countries, with 58% in Europe, 24% in Australia, and 18% in Japan.
You invest $10,000. After one year, the index rises 8.7%, and your holdings grow to $10,870. The fund pays a dividend yield of 2.9%, reinvested automatically. Over five years, compounded growth averages 6.1% annually, outperforming inflation and matching the long-term average for developed international equities.
Understanding non US stock index is essential for building resilient, globally diversified portfolios. It offers access to different economic cycles, currencies, and growth drivers-key elements in long-term wealth preservation.