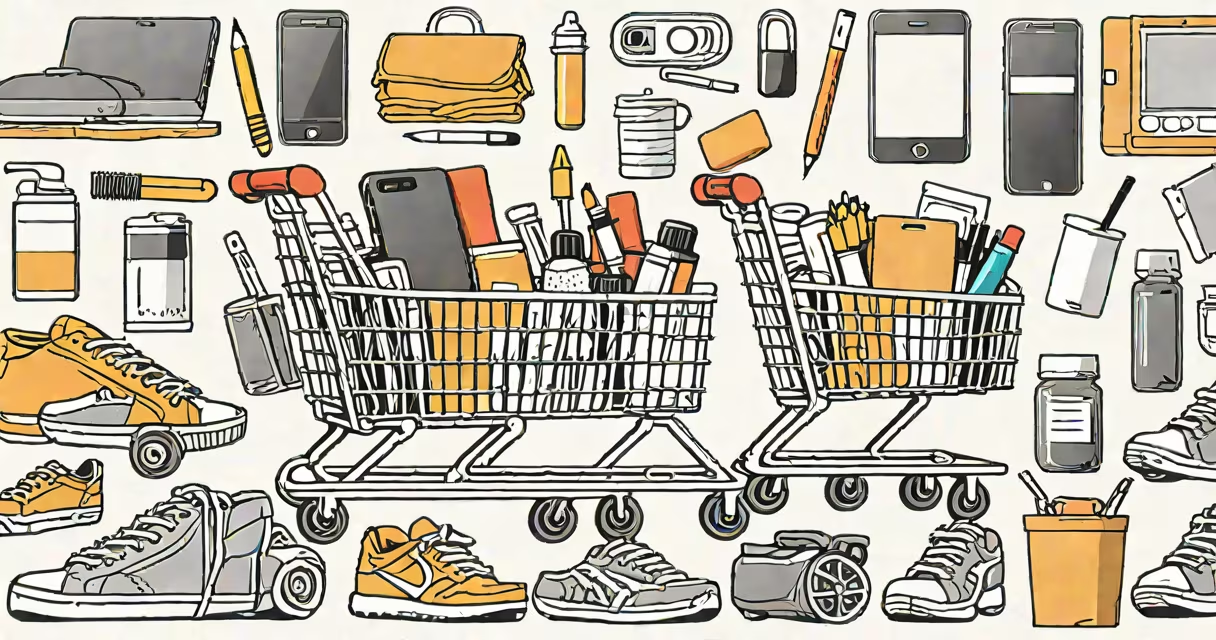
The most purchased items online are electronics, apparel, home goods, and personal care products. These categories consistently rank highest in global e-commerce sales due to high demand, low return rates, and widespread availability across platforms.
Electronics lead in dollar volume. Smartphones, laptops, and headphones account for nearly 30% of all online product sales in North America and Western Europe, according to Statista's 2023 Global E-Commerce Report. Apparel follows closely, with clothing and footwear making up 22% of online transactions. Home essentials-including kitchen tools, cleaning supplies, and small appliances-round out the top three.
These categories dominate because they're frequently replaced, have standardized sizing, and benefit from fast shipping networks. Amazon, Walmart.com, and Shopify merchants report that 65% of their daily orders fall into these four groups. Retailers improve inventory and marketing around them, reinforcing their dominance.
Online shoppers prioritize convenience, price comparison, and delivery speed. Platforms use algorithms to surface products based on past behavior, location, and trending searches. This creates feedback loops where high visibility increases purchase likelihood.
For example, a user who searches "wireless earbuds" sees results ranked by popularity, customer ratings, and estimated delivery time. Products with 4.5-star reviews and free two-day shipping appear at the top. This system drives higher sales for items already in demand.
Seasonal spikes further influence rankings. Black Friday sees a 40% increase in electronics sales compared to average months. Back-to-school season boosts apparel and school supplies by 35%. These predictable surges allow retailers to stock ahead and adjust pricing dynamically.
The following table outlines the most purchased categories by region and approximate share of total online sales in 2023.
| Category | Global Share of Online Sales | Top Subcategories | Key Drivers |
|---|---|---|---|
| Electronics | 29% | Smartphones, laptops, headphones | High frequency of upgrades, brand loyalty |
| Apparel & Footwear | 22% | Jeans, t-shirts, running shoes | Fast fashion cycles, size standardization |
| Home Goods | 18% | Kitchen gadgets, cleaning supplies, decor | Low return rates, recurring need |
| Beauty & Personal Care | 15% | Skin serums, makeup kits, razors | Subscription models, influencer marketing |
Beauty products show a unique trend: 60% of buyers choose subscription-based auto-replenishment. This model reduces decision fatigue and ensures steady revenue for brands. Sephora and Ulta report that 40% of their online sales come from auto-shipping programs.
Electronics often see higher average order values. A single smartphone purchase averages $750, while a pair of jeans typically costs $45. This means electronics generate disproportionate revenue despite lower unit volume.
Many assume that novelty or viral products drive the most sales. In reality, bestsellers are rarely new. According to McKinsey's 2023 Consumer Behavior Study, 78% of top-performing online items were existing models with proven performance. New launches make up less than 10% of total units sold.
Another misconception is that international buyers favor different categories. Data from PayPal's 2023 Cross-Border E-Commerce Report shows that electronics and apparel are the top two categories globally, with regional differences under 5 percentage points. Even in Southeast Asia and Latin America, smartphones and clothing lead sales.
A lesser-known fact: returns are lowest for home goods. While electronics have a 12% return rate, home items like kitchenware and storage bins return at just 4%. This makes them highly profitable for sellers due to reduced logistics cost and better margins.
In October 2023, Apple's iPhone 15 accounted for 18% of all smartphone sales on Amazon. It was listed in 12,400 product bundles and appeared in 76% of search results for "best phone 2023."
By December 10, Amazon reported 2.3 million iPhone 15 units sold through its platform alone. This represented 31% of all smartphone sales in the U.S. during that month. The device was promoted via targeted ads, influencer reviews, and bundled deals with AirPods.
Behind the scenes, Amazon's algorithm prioritized listings with high customer satisfaction scores and fast fulfillment times. The iPhone 15 had a 4.8-star rating and 97% of orders shipped within two days. These factors contributed directly to its ranking and conversion rate.
This example illustrates how product popularity is shaped by both demand and operational efficiency. High sales aren't accidental-they result from consistent supply, positive feedback, and strategic placement.
For real-time insights into what people are buying online, consult reports from Statista, McKinsey, and the U.S. Census Bureau's Quarterly E-Commerce Survey. These sources track changes in purchasing behavior across demographics and geographies.
Understanding the most purchased items online reveals patterns beyond simple preference. It reflects infrastructure, supply chain efficiency, and consumer trust in established brands. The top categories remain stable because they meet basic needs, integrate into daily routines, and adapt quickly to changing conditions.