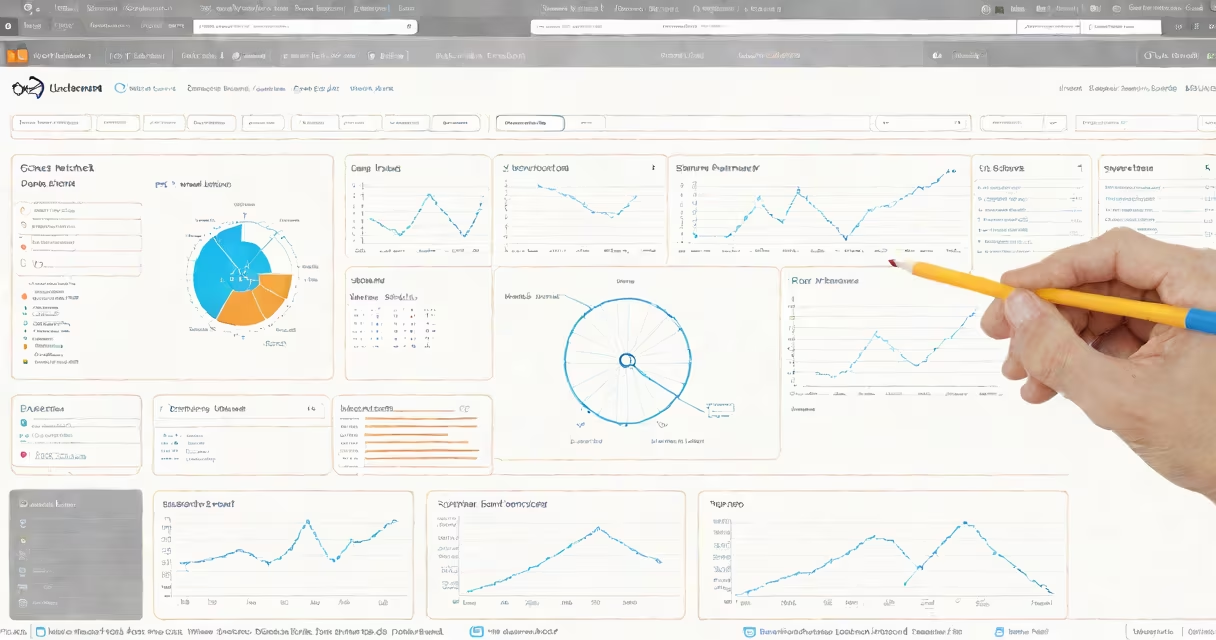
Learn Dash is a Python-based structure for creating interactive web dashboards without requiring knowledge of HTML, CSS, or JavaScript. It uses declarative syntax to build visualizations and user controls, making it ideal for data scientists and analysts who want to share insights quickly.
Developed by Plotly, Learn Dash runs on Flask and integrates smoothly with Pandas, NumPy, and Matplotlib. It renders dashboards in a browser using the Dash Core Components library, which provides reusable UI elements like sliders, dropdowns, and graphs.
For example, a team analyzing sales data can build a dashboard that updates a bar chart in real time based on user-selected regions and date ranges-all with fewer than 50 lines of Python code.
Learn Dash operates on a client-server model. The server runs a Python script that defines the layout and behavior of the dashboard. When a user opens the dashboard in a browser, the server sends the initial interface and listens for events like button clicks or slider movements.
Each component-like a graph or dropdown-is defined using a dictionary-like structure. For instance, a basic chart is created with:
import dash
from dash import dcc, html

app = dash.Dash(__name__)
app.layout = html.Div([
    html.H1("Sales Dashboard"),
    dcc.Graph(id='sales-chart', figure={'data': [{'x': [1, 2, 3], 'y': [10, 20, 30], 'type': 'bar'}]})
])

if __name__ == '__main__':
    app.run_server(debug=True)
This code generates a simple dashboard with a title and a bar chart. The figure parameter accepts a dictionary that defines the data and styling. No HTML or JavaScript is needed.
Learn Dash uses a modular architecture. The main parts are:
html and dcc components. These are Python objects that map to DOM elements.Here's a callback that updates a chart based on a dropdown selection:
@app.callback(
    Output('sales-chart', 'figure'),
    Input('region-dropdown', 'value')
)
def update_chart(selected_region):
    filtered_data = df[df['region'] == selected_region]
    return {
        'data': [{'x': filtered_data['month'], 'y': filtered_data['revenue'], 'type': 'line'}],
        'layout': {'title': f'Revenue in {selected_region}'}
    }
When the user selects a region from the dropdown, the function filters the data and returns a new chart configuration. The browser updates automatically.
Learn Dash is widely used in business intelligence, research, and education. Its strength lies in turning static reports into changing tools.
Data analysts at financial firms use it to monitor trading patterns. A single dashboard can display real-time stock prices, volume trends, and sentiment scores-all updated every 30 seconds via API calls.
In academia, researchers use Learn Dash to visualize simulation results. One study on climate change used a dashboard to show temperature projections under different emission scenarios. Users could toggle between models and view uncertainty bands.
Learn Dash is not a replacement for full-stack web development. It doesn't support complex routing, authentication, or database management out of the box. It's designed for internal tools and data exploration-not public websites or user-facing applications.
It's also not a visualization library. While it uses Plotly for charts, it doesn't handle data cleaning or statistical modeling. You still need Pandas or Scikit-learn for preprocessing.
A common misconception is that Learn Dash requires a web server to run. While it's typically deployed with a server, it can be run locally during development. The debug=True flag in run_server() enables auto-reload and error reporting.
Unlike frameworks such as Streamlit or Shiny, Learn Dash separates layout and logic explicitly. This makes it easier to manage large dashboards with many interdependent components.
Another difference: Learn Dash supports custom JavaScript through the dash_cytoscape and dash_html_components extensions. But this is advanced usage. Most users stick to the standard components.
One often overlooked feature is the ability to export dashboards as standalone HTML files. Using dash.development.base_component.BaseComponent.to_html(), you can embed a dashboard in a report or email. This is useful for sharing with stakeholders who don't have Python access.
A hospital in Boston built a Learn Dash dashboard to track patient vitals across three wards. The data came from a PostgreSQL database, pulled every 5 minutes.
The dashboard included:
Using dash-callbacks, the system updated the chart every 60 seconds. When a patient's blood pressure dropped below 90/60, a red marker appeared on the timeline.
After deployment, nurses reported a 22% reduction in response time to critical events. The dashboard was accessible on tablets in each ward, with no training required.
To begin, install Learn Dash via pip:
pip install dashCreate a file called app.py and start with a minimal layout. Run it with:
python app.pyOpen http://127.0.0.1:8050 in your browser. The dashboard appears instantly.
For deeper learning, explore the official documentation at Plotly's Dash site. It includes tutorials on callbacks, styling, and deployment.
Remember: Learn Dash is not a magic tool. It reduces frontend complexity but still demands clear thinking about data flow and user needs. A well-designed dashboard starts with a clear question, not a shiny chart.