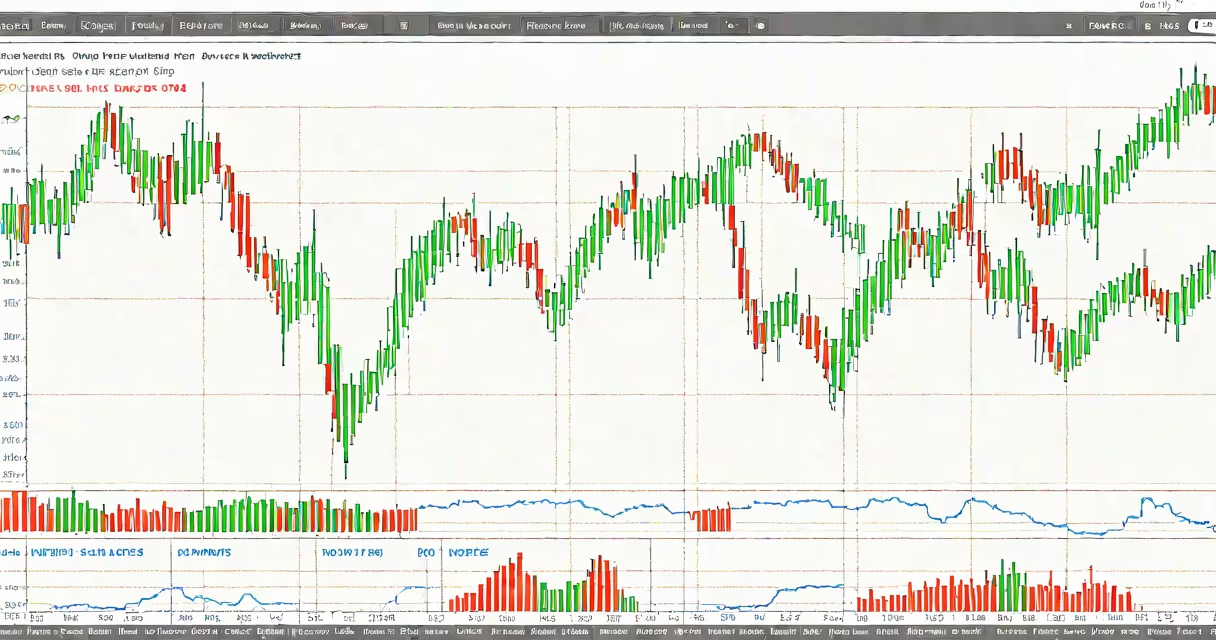
Highest implied volatility is the peak level of expected price movement in an underlying asset, derived from the current prices of options contracts. It reflects the market's collective expectation of future uncertainty, often surging during crises or major news events.
Implied volatility is not a direct measure of actual price changes. Instead, it's inferred from the premium paid for options. When buyers demand higher premiums due to fear or anticipation of big moves, the implied volatility rises. The highest implied volatility occurs when option prices reflect maximum anticipated volatility-often seen during earnings announcements, central bank decisions, or geopolitical shocks.
For example, during the 2020 COVID-19 market crash, the CBOE Volatility Index (VIX), which tracks implied volatility of S&P 500 options, spiked to 85.5 - its highest level since 2008. This marked the highest implied volatility in the S&P 500 options market in over a decade, signaling extreme market stress and widespread expectation of large price swings.
Implied volatility is calculated using option pricing models like Black-Scholes. These models take the current market price of an option and reverse-engineer the volatility value that would produce that price. A higher option price, assuming all else is equal, implies higher implied volatility.
The model assumes constant volatility, but real markets don't work that way. So traders use implied volatility as a forward-looking gauge. When it climbs, it suggests increased risk perception. When it drops, it indicates complacency or reduced fear.
For instance, if a stock trades at $100 and its 30-day implied volatility reaches 80%, the market expects a potential move of ±$100 × 80% = ±$80 over the next month, based on standard deviation assumptions. That's a massive swing-more than 50% in either direction-indicating extreme uncertainty.
Implied volatility is not a physical quantity. It's a mathematical output derived from option prices. Its components include:
Unlike historical volatility-which measures past price fluctuations-implied volatility is forward-looking. It doesn't care what happened yesterday. It only cares what the market thinks will happen tomorrow.
Many assume that high implied volatility means the asset will actually move sharply. That's incorrect. High implied volatility means the market expects a large move-but not necessarily that one will occur. It's a forecast, not a guarantee.
Another mistake is confusing implied volatility with realized volatility. Realized volatility measures actual price changes after the fact. Implied volatility is a prediction embedded in option prices. The two can diverge. For example, in late 2021, Tesla's implied volatility was above 100% for weeks, yet its actual monthly price swings averaged around 30%. The gap shows that markets were pricing in extreme fear, even when price action didn't match.
A lesser-known fact: implied volatility tends to spike more on short-term options. A 1-week option can show much higher implied volatility than a 6-month option-even if the underlying asset is stable. This happens because short-term options are more sensitive to news and surprises.
Traders use highest implied volatility to assess risk, set positions, and time entries. High levels signal opportunities for selling options (selling premium) when volatility is expected to drop-a strategy known as "volatility harvesting."
Portfolio managers monitor implied volatility to adjust hedging strategies. For example, if implied volatility on a tech stock jumps before earnings, a fund may buy out-of-the-money puts to protect against a sudden drop.
Here's a real-world example: in January 2022, GameStop's implied volatility hit 1,200% before its quarterly earnings report. This meant the market priced in a potential 50% move up or down in a single day. After the report, volatility dropped to 300% within hours. Traders who sold options before the event captured significant premium, while those who bought long calls lost money due to the rapid decay in implied volatility.
Implied volatility varies by instrument and timeframe. Here's how it differs across common categories:
| Type | Typical Implied Volatility Range | When It Peaks |
|---|---|---|
| SPX (S&P 500) options | 10-30% | During recessions, Fed meetings |
| Individual stocks (e.g., AAPL) | 20-60% | Before earnings, product launches |
| High-beta stocks (e.g., NVDA) | 40-100% | After major news, sector shifts |
| Commodities (e.g., crude oil) | 30-80% | Geopolitical tensions, supply disruptions |
These ranges aren't fixed. In 2020, crude oil options briefly traded with implied volatility above 200% during lockdowns. That's rare but not impossible.
Also, implied volatility isn't uniform across strike prices. The "volatility smile" describes how implied volatility varies by strike-often higher for out-of-the-money options. This reflects market participants' belief that extreme moves (up or down) are more likely than moderate ones.
In 2021, I monitored implied volatility on a small-cap biotech stock before FDA approval results. The 30-day implied volatility rose from 40% to 180% in two days. I saw traders placing straddles-simultaneous long calls and puts-betting on a big move. After the announcement, the stock moved 35% in one session, but implied volatility collapsed to 60% the next day. The premium decay wiped out many long option positions, proving that high implied volatility doesn't mean profits-it means risk.
highest implied volatility is not a number you chase. It's a signal. It reveals what the market fears most and how much it's willing to pay for protection. Traders who understand it avoid buying expensive options during panic. Those who sell them can profit from the inevitable drop in volatility after the event passes.
Understanding this concept helps avoid emotional decisions. When implied volatility spikes, it's not a sign to enter trades-it's a warning to wait. The market is pricing in fear, not facts.