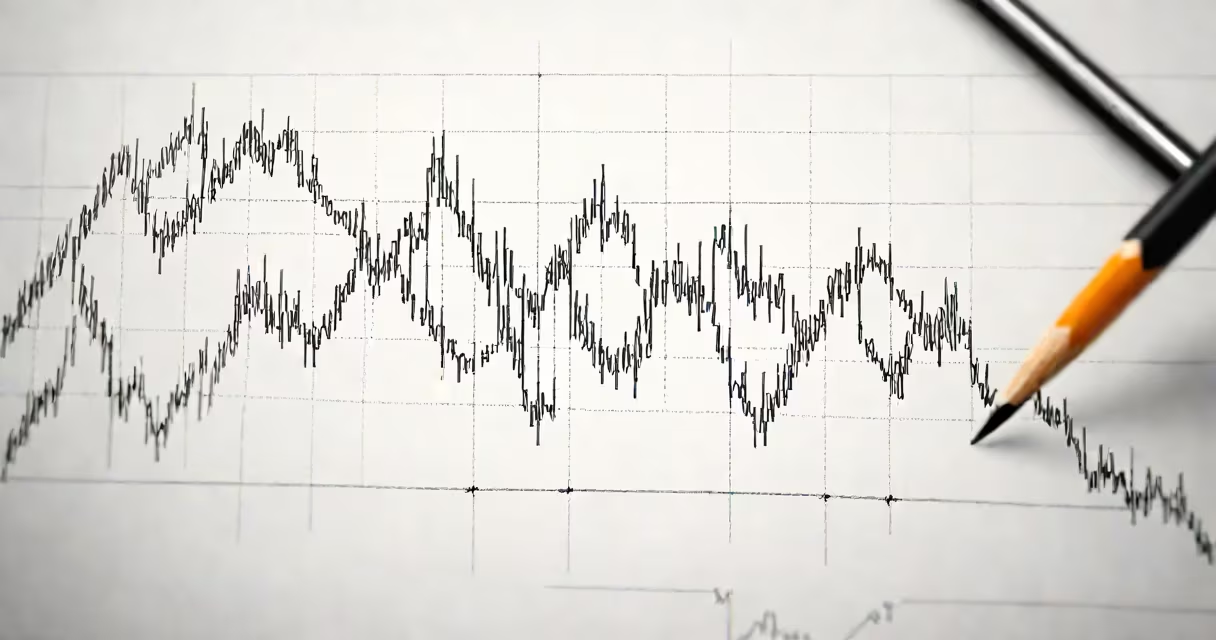
Over bought stock refers to a security whose price has risen too quickly and too far above its intrinsic value, often driven by speculative demand rather than fundamentals. This condition typically signals a high risk of a price reversal or pullback.
When a stock becomes over bought, it means traders have pushed the price higher than what underlying financial metrics-like earnings, revenue, or cash flow-justify. This imbalance increases the likelihood that sellers will enter the market, triggering a decline. Over bought conditions are common during market bubbles, hype cycles, or after viral social media momentum.
Technical analysts track over bought levels using tools like the Relative Strength Index (RSI), moving averages, and volume surges. A reading above 70 on the RSI suggests a stock may be over bought, though this threshold varies by asset class and time frame. For example, in volatile sectors like tech or biotech, readings above 65 can signal over bought status.
Over bought stock develops when demand outpaces supply. This happens through aggressive buying behavior, often fueled by news, analyst upgrades, or FOMO (fear of missing out). As more investors buy, the price climbs, creating a feedback loop where rising prices attract even more buyers.
For instance, in January 2021, GameStop (GME) surged over 1,800% in a month after retail investors coordinated purchases via Reddit's r/WallStreetBets. The stock reached $480 per share-well above any reasonable valuation based on earnings or assets. At that point, GME was over bought, and the subsequent drop to under $20 within weeks confirmed the reversal.
Market psychology plays a major role. Traders assume past gains will continue, ignoring signs of exhaustion. Volume often spikes during over bought phases, but the increase is not backed by sustained fundamental strength. Instead, it reflects emotional participation, not economic rationale.
Traders use several tools to detect over bought conditions. The most widely used is the RSI, which measures the speed and change of price movements. An RSI above 70 indicates over bought territory, while below 30 signals over sold. However, RSI can remain elevated in strong uptrends, so context matters.
Volume analysis also reveals over bought behavior. A surge in trading volume during a price rise-especially on declining volume during pullbacks-suggests distribution is underway. For example, if a stock jumps 10% on 300% above average volume but then fails to sustain gains on lower volume, it may be nearing a peak.
Price patterns offer visual confirmation. A "double top" or "head and shoulders" formation often appears near over bought peaks. These shapes form when price reaches a resistance level twice and fails to break through, signaling exhaustion in buying momentum.
| Indicator | Over Bought Threshold | Source |
|---|---|---|
| RSI (14-day) | 70+ | CFA Institute, *Investment Analysis and Portfolio Management* |
| Price-to-Earnings (P/E) Ratio | 2 standard deviations above sector median | SEC Form 10-K filings, S&P Global Market Intelligence |
| Volume Spike | 3x average daily volume | TradingView Technical Analysis Guide |
One non-obvious point: over bought doesn't mean immediate collapse. Stocks can stay over bought for days or weeks, especially in trending markets. The 2021 surge in Tesla (TSLA) saw RSI values above 80 for multiple sessions, yet the stock continued rising. This shows that momentum can override technical warnings in strong bull markets.
Many confuse over bought with overvalued. Over bought refers to short-term price action and sentiment. Overvalued describes long-term mispricing based on fundamentals. A stock can be over bought without being overvalued-especially if earnings are growing faster than the price.
Another error is assuming all reversals follow over bought signals. Not every spike leads to a drop. Some stocks consolidate after a rally, then resume their trend. The key is distinguishing between temporary pullbacks and structural breakdowns.
I once watched a client sell a position in a small-cap biotech stock after RSI hit 75. The stock dropped 12% the next day, confirming the warning. But two weeks later, it rebounded 30% on positive trial results. The initial sell signal was correct, but timing mattered. That's why over bought alerts should trigger caution-not automatic exit decisions.
Traders use several approaches when a stock becomes over bought. One is scaling out-selling a portion of the position to lock in profits while holding the rest for potential continuation. This balances risk and reward.
Another is setting stop-loss orders below recent swing lows. If the stock breaks support, the stop triggers a sale before losses grow. For example, if a stock peaks at $150 and drops to $140, a stop at $138 protects capital.
Some traders avoid entering new positions in over bought stocks altogether. They wait for a pullback or consolidation phase. This reduces exposure to sudden reversals. In my view, patience beats urgency in volatile environments.
For those tracking specific equities, 3 MMM stock has shown consistent momentum since 2022. Its RSI has repeatedly touched 70, but it hasn't reversed. This illustrates that strong fundamentals can sustain over bought readings longer than expected. Always cross-check technicals with company performance.
Over bought stock is not a prediction-it's a warning sign. It highlights a potential imbalance between price and value, increasing the odds of a correction. But it doesn't guarantee one. Successful traders use over bought signals as part of a broader structure that includes fundamentals, volume, and market structure.
Understanding this distinction prevents knee-jerk reactions. A stock can be over bought and still rise. But ignoring the warning increases risk. Always verify with multiple indicators and avoid emotional trading.