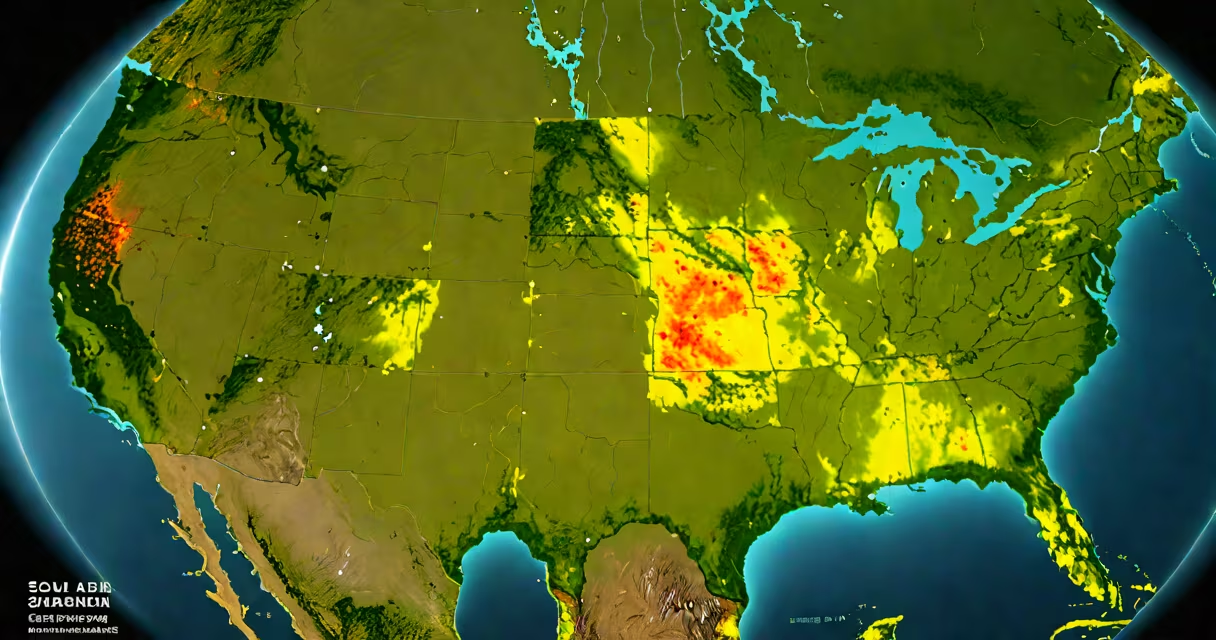
solar resource maps display the distribution of solar irradiance across geographic regions, showing how much sunlight is available annually for energy generation. These tools combine satellite imagery, ground-based sensor data, and atmospheric models to estimate solar energy potential at specific locations.
They serve as foundational inputs for designing photovoltaic systems, evaluating site suitability, and forecasting energy output. A single map can cover entire continents or zoom into city blocks, depending on resolution and purpose.
For example, the National Renewable Energy Laboratory (NREL) provides high-resolution solar resource maps for the United States through its Solar Prospector tool. These maps include direct normal irradiance (DNI), diffuse horizontal irradiance (DHI), and global horizontal irradiance (GHI) values derived from 30 years of satellite observations.
Solar resource maps rely on geospatial analysis of historical weather patterns and atmospheric conditions. Satellites measure reflected solar radiation and cloud cover over time, while ground stations collect actual solar insolation data. Algorithms then interpolate between these points to generate continuous surface estimates.
The process begins with radiative transfer models that simulate how sunlight interacts with Earth's atmosphere. Variables such as aerosol concentration, water vapor levels, and ozone thickness affect how much solar energy reaches the surface. These are calibrated using ground-truth measurements from networks like the Baseline Surface Radiation Network (BSRN).
For instance, NREL's PVWatts Calculator uses a solar resource map to estimate annual electricity production for a rooftop system. Inputting a zip code returns expected kWh per kW installed based on long-term averages. A 5-kW system in Phoenix, Arizona, generates approximately 8,300 kWh/year due to high GHI (2,010 kWh/m²/year), while the same system in Seattle, Washington, produces only 5,800 kWh/year due to lower GHI (1,450 kWh/m²/year).
Different solar resource maps emphasize distinct metrics based on application. The most common are:
| Map Type | Data Measured | Primary Use Case | Typical Resolution |
|---|---|---|---|
| Global Horizontal Irradiance (GHI) | Total solar energy on a flat surface | Rooftop PV system sizing | 1 km² (NREL) |
| Direct Normal Irradiance (DNI) | Beam radiation perpendicular to sun's path | Concentrated solar power (CSP) plants | 1 km² (NASA POWER) |
| Diffuse Horizontal Irradiance (DHI) | Scattered light from clouds and sky | Performance modeling under cloudy conditions | 1 km² (PVGIS) |
Some maps also include seasonal variation, diurnal cycles, and uncertainty bands. The European Union's Copernicus Atmosphere Monitoring Service offers maps with hourly resolution for grid integration planning. These allow utilities to model how solar output fluctuates throughout the day and across seasons.
A lesser-known but critical feature is the inclusion of albedo (surface reflectivity). Snow-covered areas can increase incident solar radiation by up to 80% compared to dark soil. This effect is captured in high-accuracy maps used for alpine solar projects in the Swiss Alps.
Many assume solar resource maps represent current conditions. They do not. These are statistical averages over decades, typically 10 to 30 years. A map showing 1,800 kWh/m²/year in California reflects long-term trends, not today's weather.
Another error is treating a single value as definitive. For example, a location listed as having 2,100 kWh/m²/year GHI still experiences variability. A 2022 study published in *Renewable Energy* found that actual annual yields for commercial installations deviated from map predictions by ±12% on average due to microclimatic effects like fog in coastal California.
Finally, users often overlook spatial resolution. A 10 km² map may misrepresent urban rooftops with complex shading. High-resolution maps (≤100 m²) are essential for detailed site assessments. The U.S. Department of Energy's SolSmart program recommends using maps with 30-meter resolution or better for municipal solar permitting.
Utility-scale developers use solar resource maps to screen hundreds of sites before investing in surveys. In 2021, a solar farm developer evaluated 47 potential sites in Nevada using NREL's Solar Resource and Photovoltaic Model (SRPM). The team filtered out sites with GHI below 2,000 kWh/m²/year and DNI above 1,800 kWh/m²/year, narrowing the list to 12 viable candidates.
One site near Tonopah scored 2,120 kWh/m²/year GHI and 2,010 kWh/m²/year DNI. Based on this data, the projected capacity factor was 22.4%. After accounting for system losses (14%), the expected annual energy output was 18.5 MWh/kW. The developer secured financing using these numbers, which were later validated during commissioning.
On the residential side, homeowners use tools like Google's Project Sunroof, which overlays solar resource data onto satellite images of their roofs. The app calculates potential savings and payback periods based on local irradiance and electricity rates. A user in San Diego reported a 25-year ROI on a 6.5-kW system after the tool estimated 10,100 kWh/year generation.
Even in industrial settings, these maps inform maintenance schedules. A semiconductor plant in New Mexico uses daily solar resource data to adjust cooling loads during peak sun hours. By aligning HVAC operations with solar availability, they reduced grid demand by 18% during summer months.
Confusion arises between solar resource maps and solar forecasts. Maps show long-term average energy availability. Forecasts predict daily or hourly solar output using real-time weather data. A forecast for tomorrow's solar generation in Denver might say "6.2 kWh/m²/day," while the resource map says "1,980 kWh/m²/year" - both correct, but different purposes.
Resource maps are static and used in planning. Forecasts are changing and used in operations. Using the wrong tool leads to poor decisions. For example, relying on a forecast to size a battery bank results in oversizing; using a map to schedule daily maintenance causes inefficiencies.
When selecting a map, verify the source and update frequency. NASA's POWER database updates biannually. NREL's NSRDB (National Solar Radiation Database) is updated every five years. Always cross-check with local meteorological records if accuracy is critical.
Solar resource maps are not just visualizations - they are predictive instruments grounded in decades of climate science. Their accuracy enables efficient deployment of solar infrastructure worldwide, reducing reliance on fossil fuels and supporting net-zero targets.